Formatting in R Markdown
Now that you have loaded your data into R, cleaned it up, and made some impressive looking plots, you probably want to show your analysis to someone else, who may or may not be an R user. R Markdown is a really easy way of creating analysis reports to share with others. It is also a useful tool for making sure that the analysis you do is well-documented and reproducible; use R Markdown and your future self will thank you.
In this lesson, we are going to walk through how to create a report using R Markdown, how to format text within your report, and add links, images, and gifs.
Lesson Outcomes
By the end of the lesson, you should be able to:
- create a R Markdown document (.rmd file)
- use heading levels to create your document structure
- make text bold and italics, and use quotes
- add links, images, tweets, and gifs to your report
How to create a R Markdown document and format text within it
In this screencast, we’ll cover:
- How to create a R Markdown document and
knitit into a report - How to use headings, bold, italics, and quotes within your report
Your turn to have a go
Watch the video and then carry out the following steps:
- Open a new R Markdown document and save it
- Knit the document
- Delete everything in the default template and knit it again
- Play around with headings, putting text in bold and italics, and adding quotes
How to insert links, images, tweets and gifs
Links
You can embed links to other web content in your R Markdown document using a combination of square and round brackets.
Put the words that you want to use as the link in square brackets, and the url that you want to link to in round brackets.
[find Rmd resources here](https://github.com/jenrichmond/RMarkdownThrowdown)
Images
Use similar notation to insert an image…

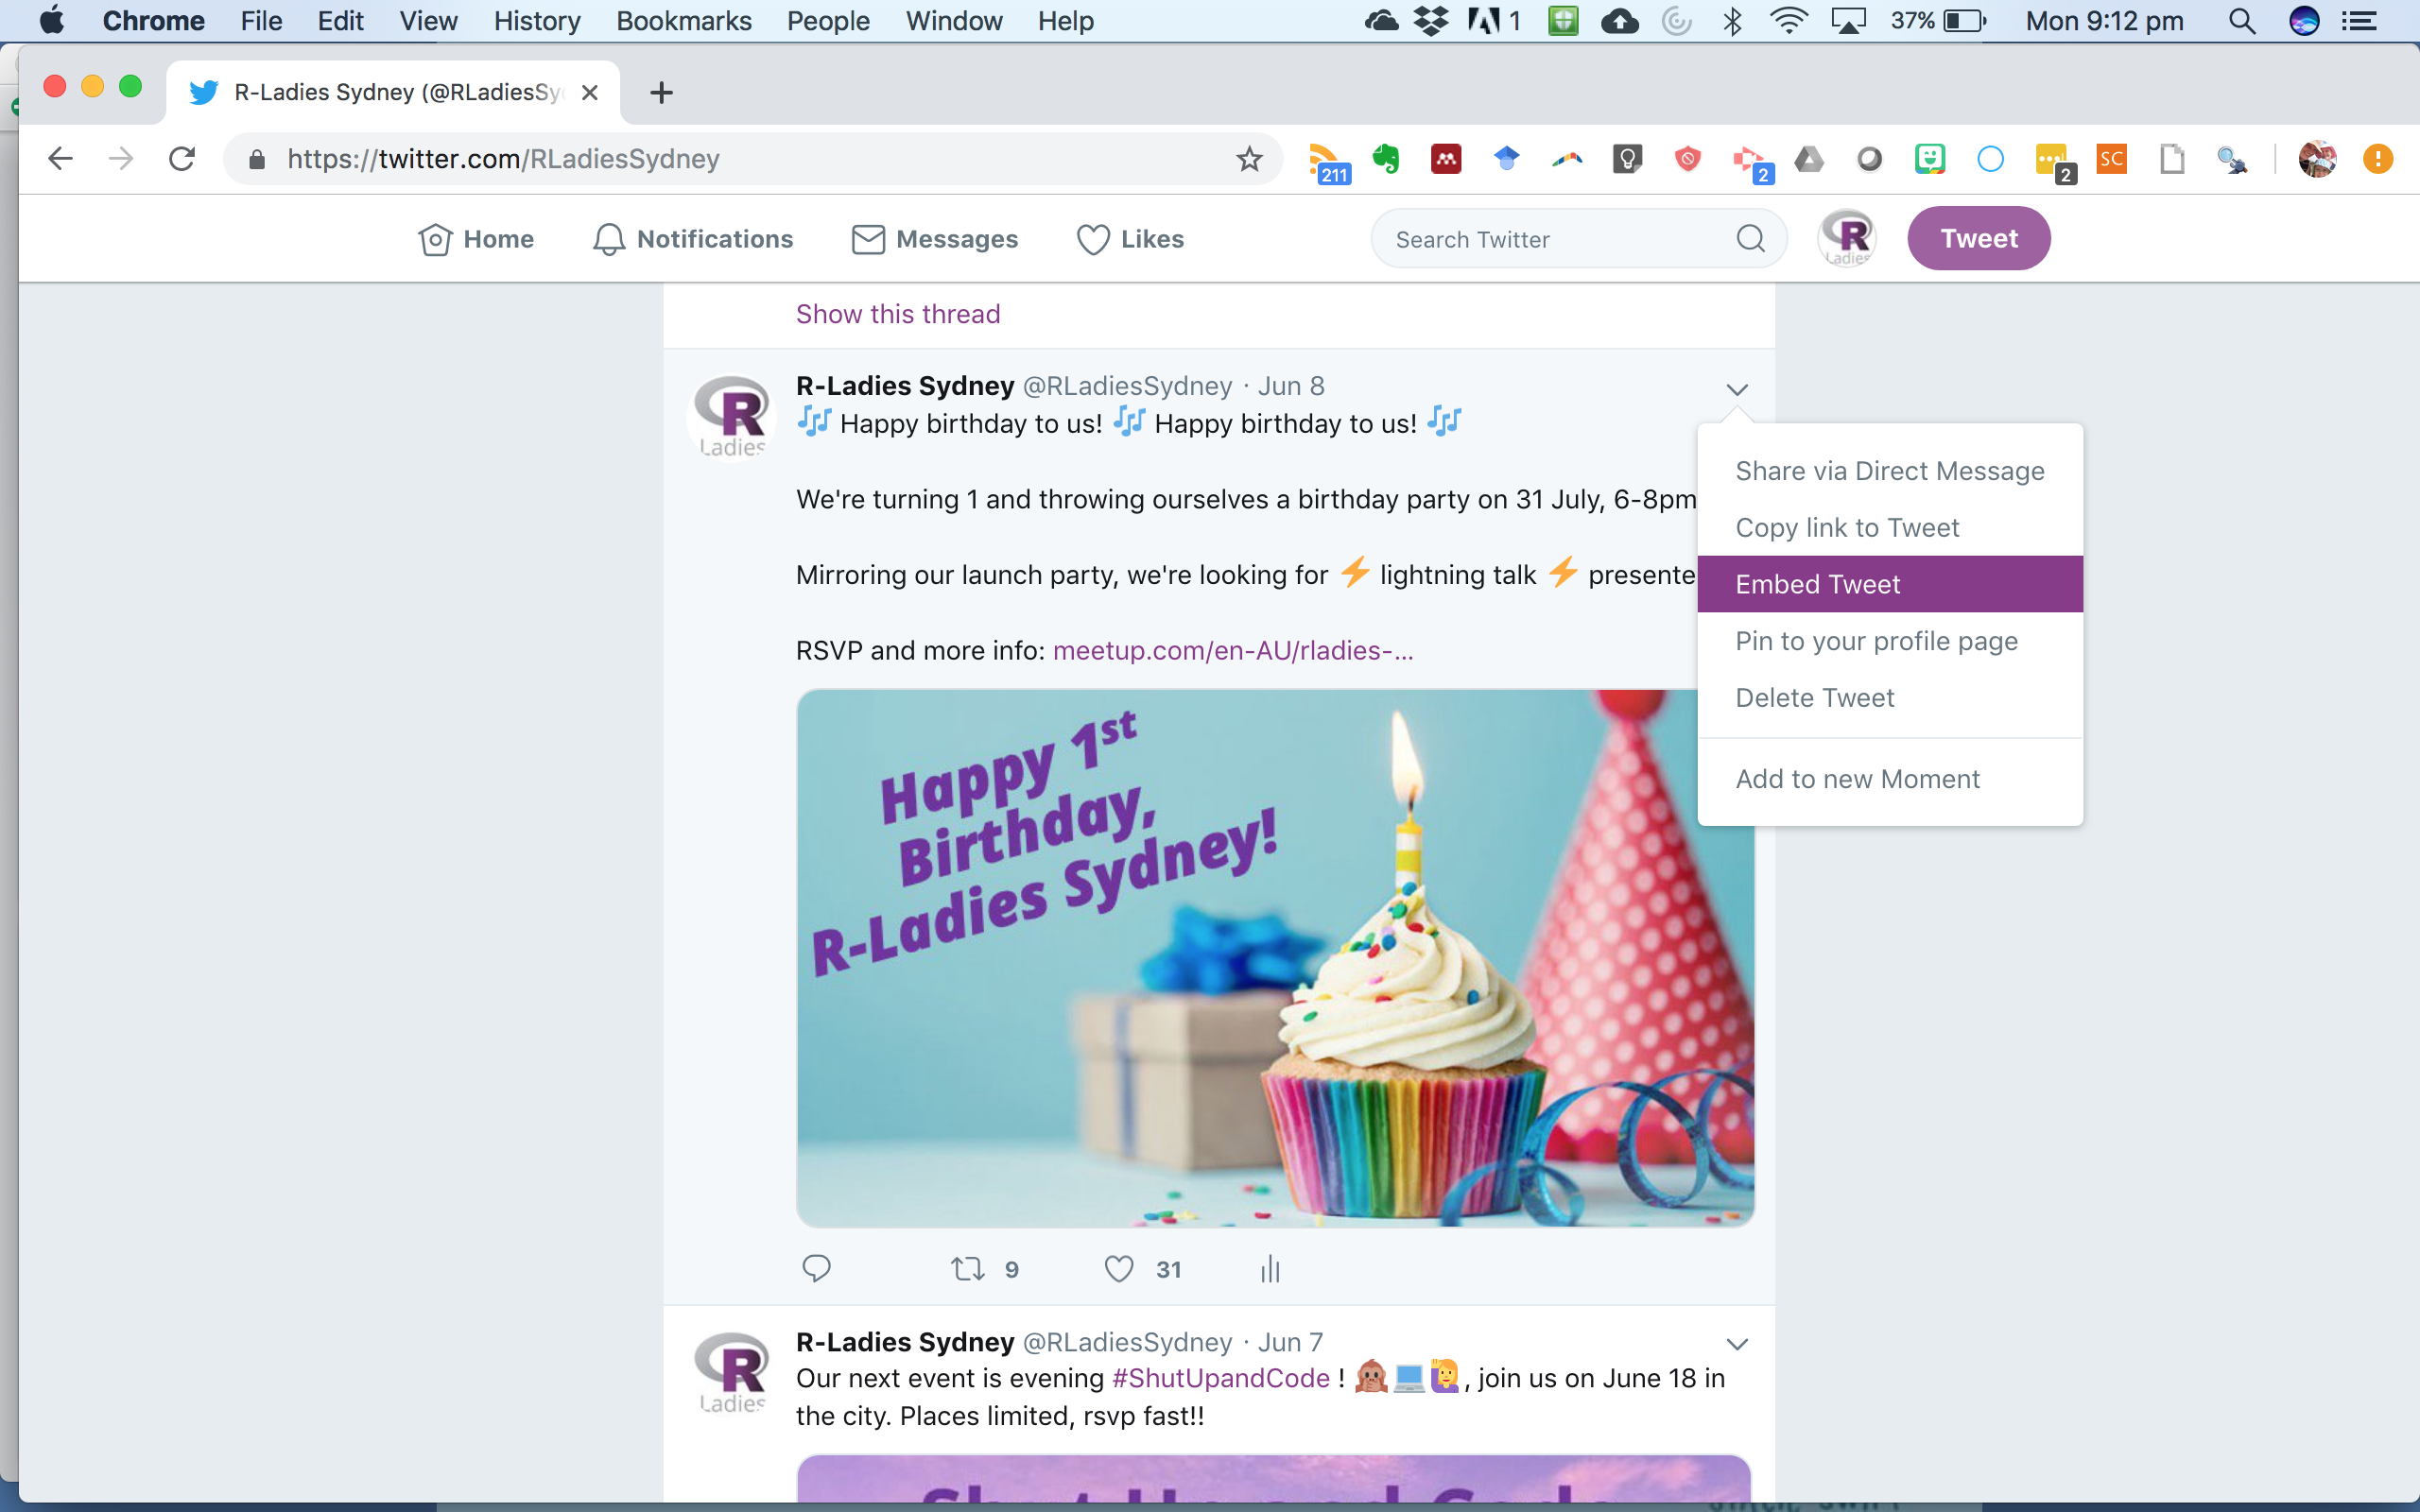
Gifs and Tweets
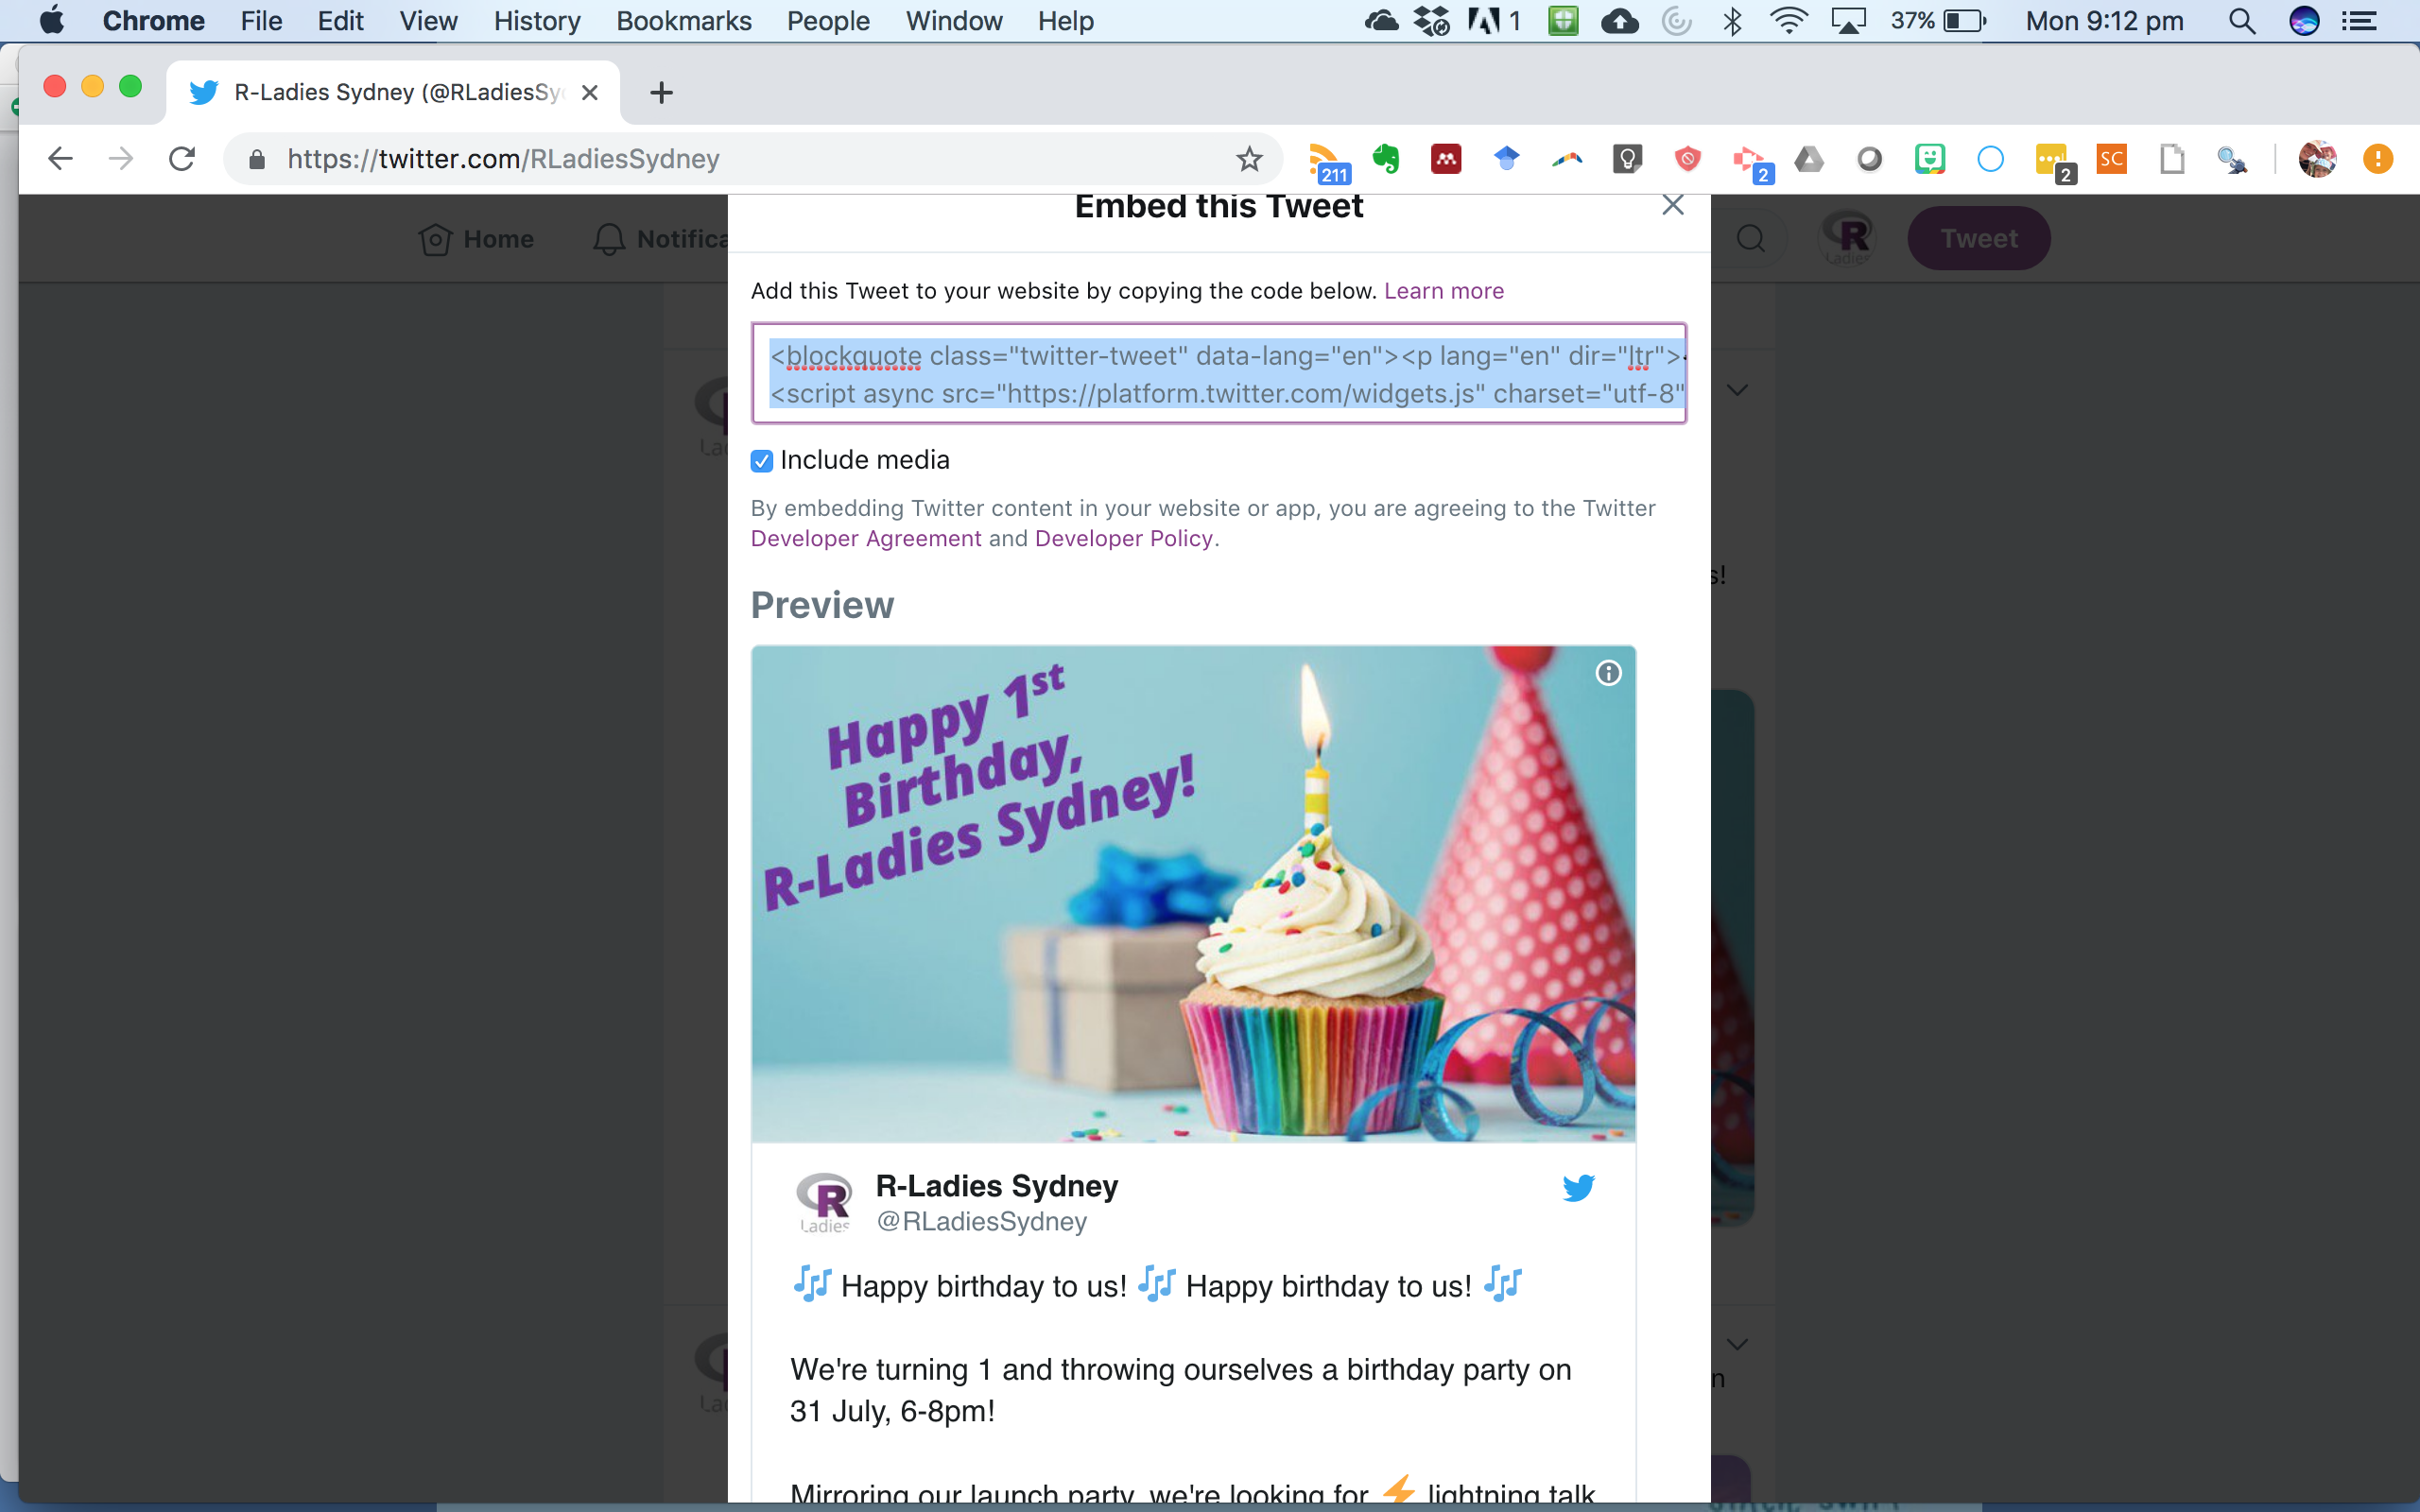
To embed gifs and tweets, choose “embed” …
… and just copy and paste the code into your R Markdown document.
In this screencast, we’ll cover:
- How to create links, add images, and embed tweets/gifs in a R Markdown document
Your turn to have a go
Watch the video and then carry out the following steps:
- Write a sentence about your favourite Tidyverse package in your .rmd document and insert a link to the vignette page for that package
- Insert an image of the hex for that package into your document
- Find a tweet about your favourite package and insert that into your document
- Find the famous gif of Hadley Wickham typing code and embed that into your document
- Knit your document!
Learn More
To learn more about formatting your R Markdown document, check out the R Markdown: The Definitive Guide, a free book written in bookdown, by Yihui Xie.
Next up in MarkyMark, lets talk about chunks. Head on to Lesson 2!