CleanItUp 4
NOTE: This lesson has been updated and we now recommend learning the
pivot_longer()andpivot_wider()functions, rather thangather()andspread(). If you are keen to skip the angst ofgather()andspread()use this link and SKIP straight to Clean it Up 5.
Wide to Long to Wide to…
Learning how to make wide data long, or long data wide, might be one of the biggest stumbling blocks that R learners encounter. Even Rlady ed experts like Jesse Mostipak freely admit to not really “getting it”.
there's a pretty large discrepancy between how well I think I know spread() and gather() and how well I actually know spread() and gather()
— Jesse Mostipak (@kierisi) October 28, 2018
Why do you need to know how to convert your data from wide to long (or vice versa)?
In R circles there is a lot of talk of the need for “tidy data”. You can read more about what Hadley Wickham (creator of the Tidyverse) means by tidy data here, but in short, tidy data is when
- Each variable forms a column.
- Each observation forms a row.
- Each type of observational unit forms a table.
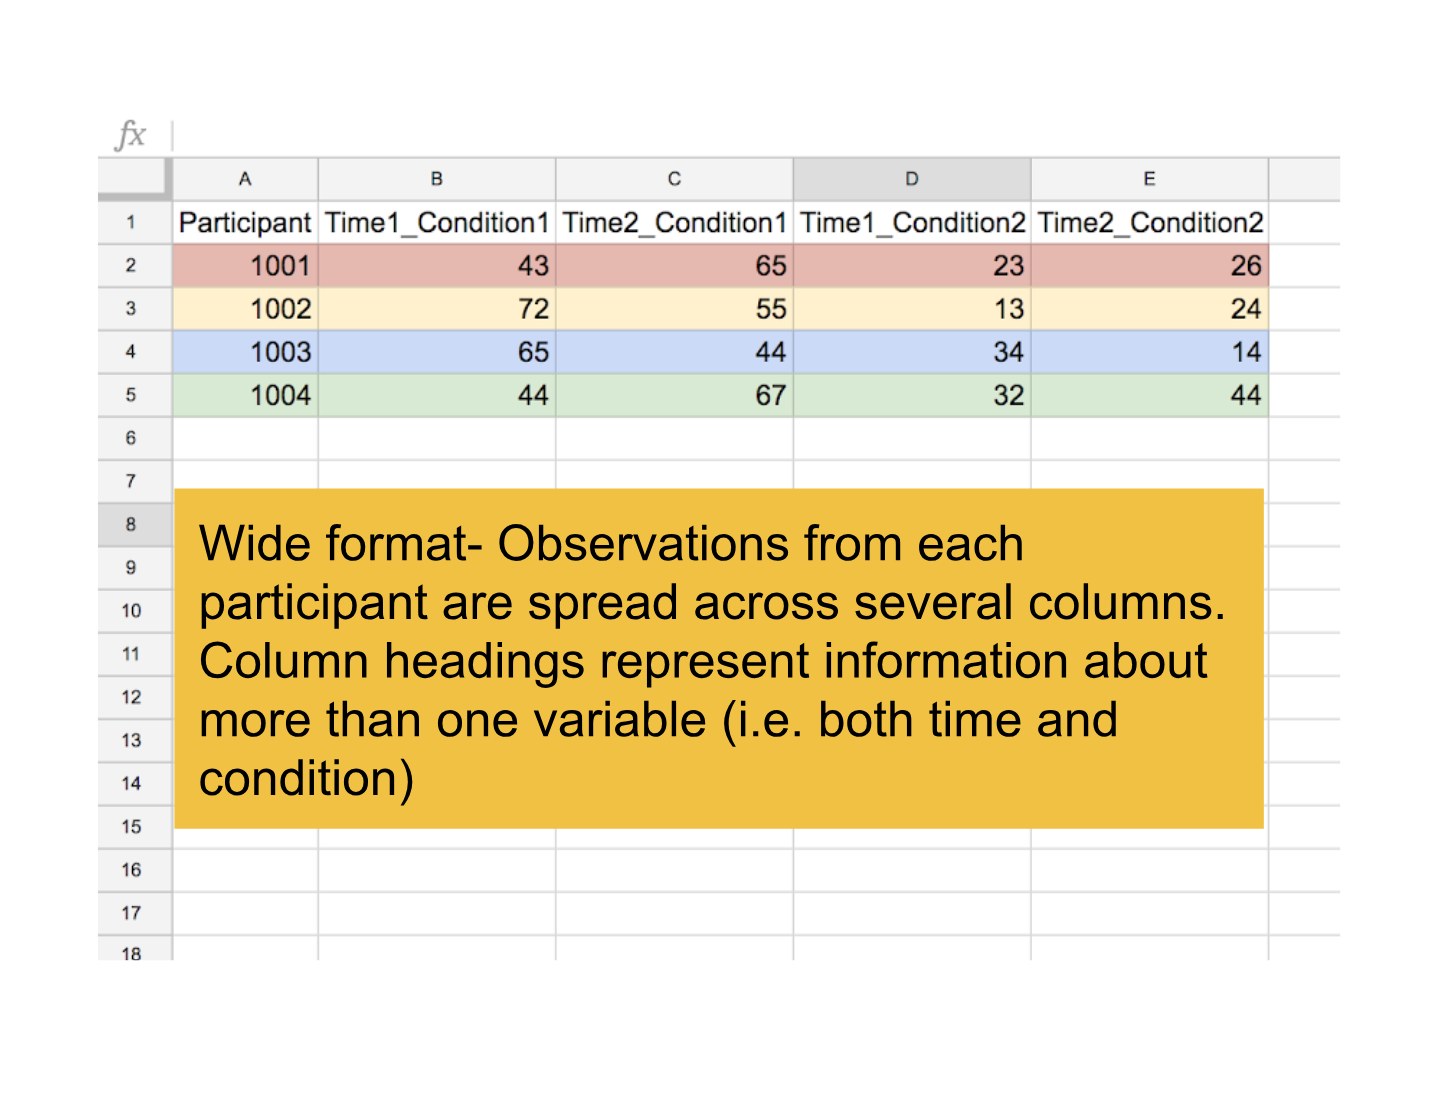
When you entered your data in excel, you probably entered it in wide format. Data in wide format has observations spread across several columns; each column contains data from a different condition (or combination of conditions). wide data is messy.
In the wide example below, we have scores from participants who were tested twice (Time 1 and Time 2) after studying different lists of words under two different conditions (Condition 1 and Condition 2).
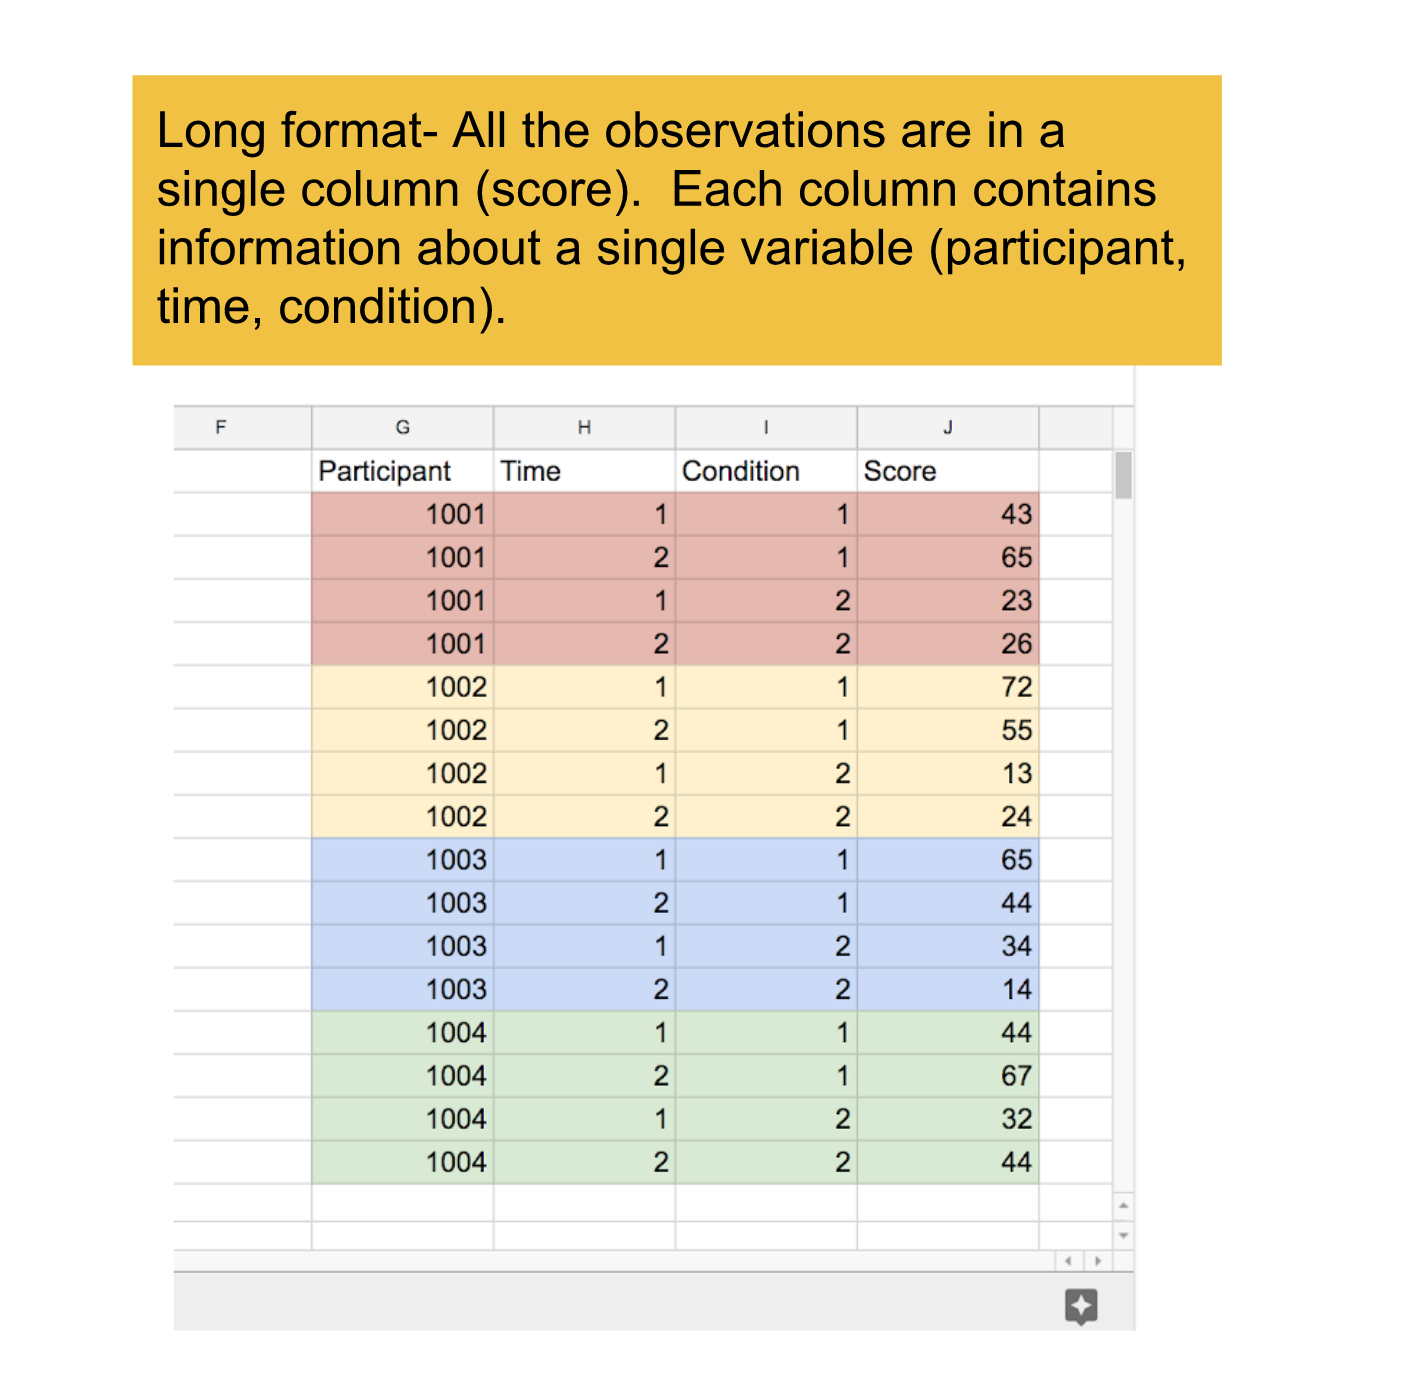
In contrast, data in long format has all the observations in a single column and variables in separate columns.
Should I could copy and paste_transpose the scores?
No, no, no… this is not as hard as it looks. R employs cute monsters under the hood to gather your data from wide to long, and spread it from long to wide. All in a single line of code.
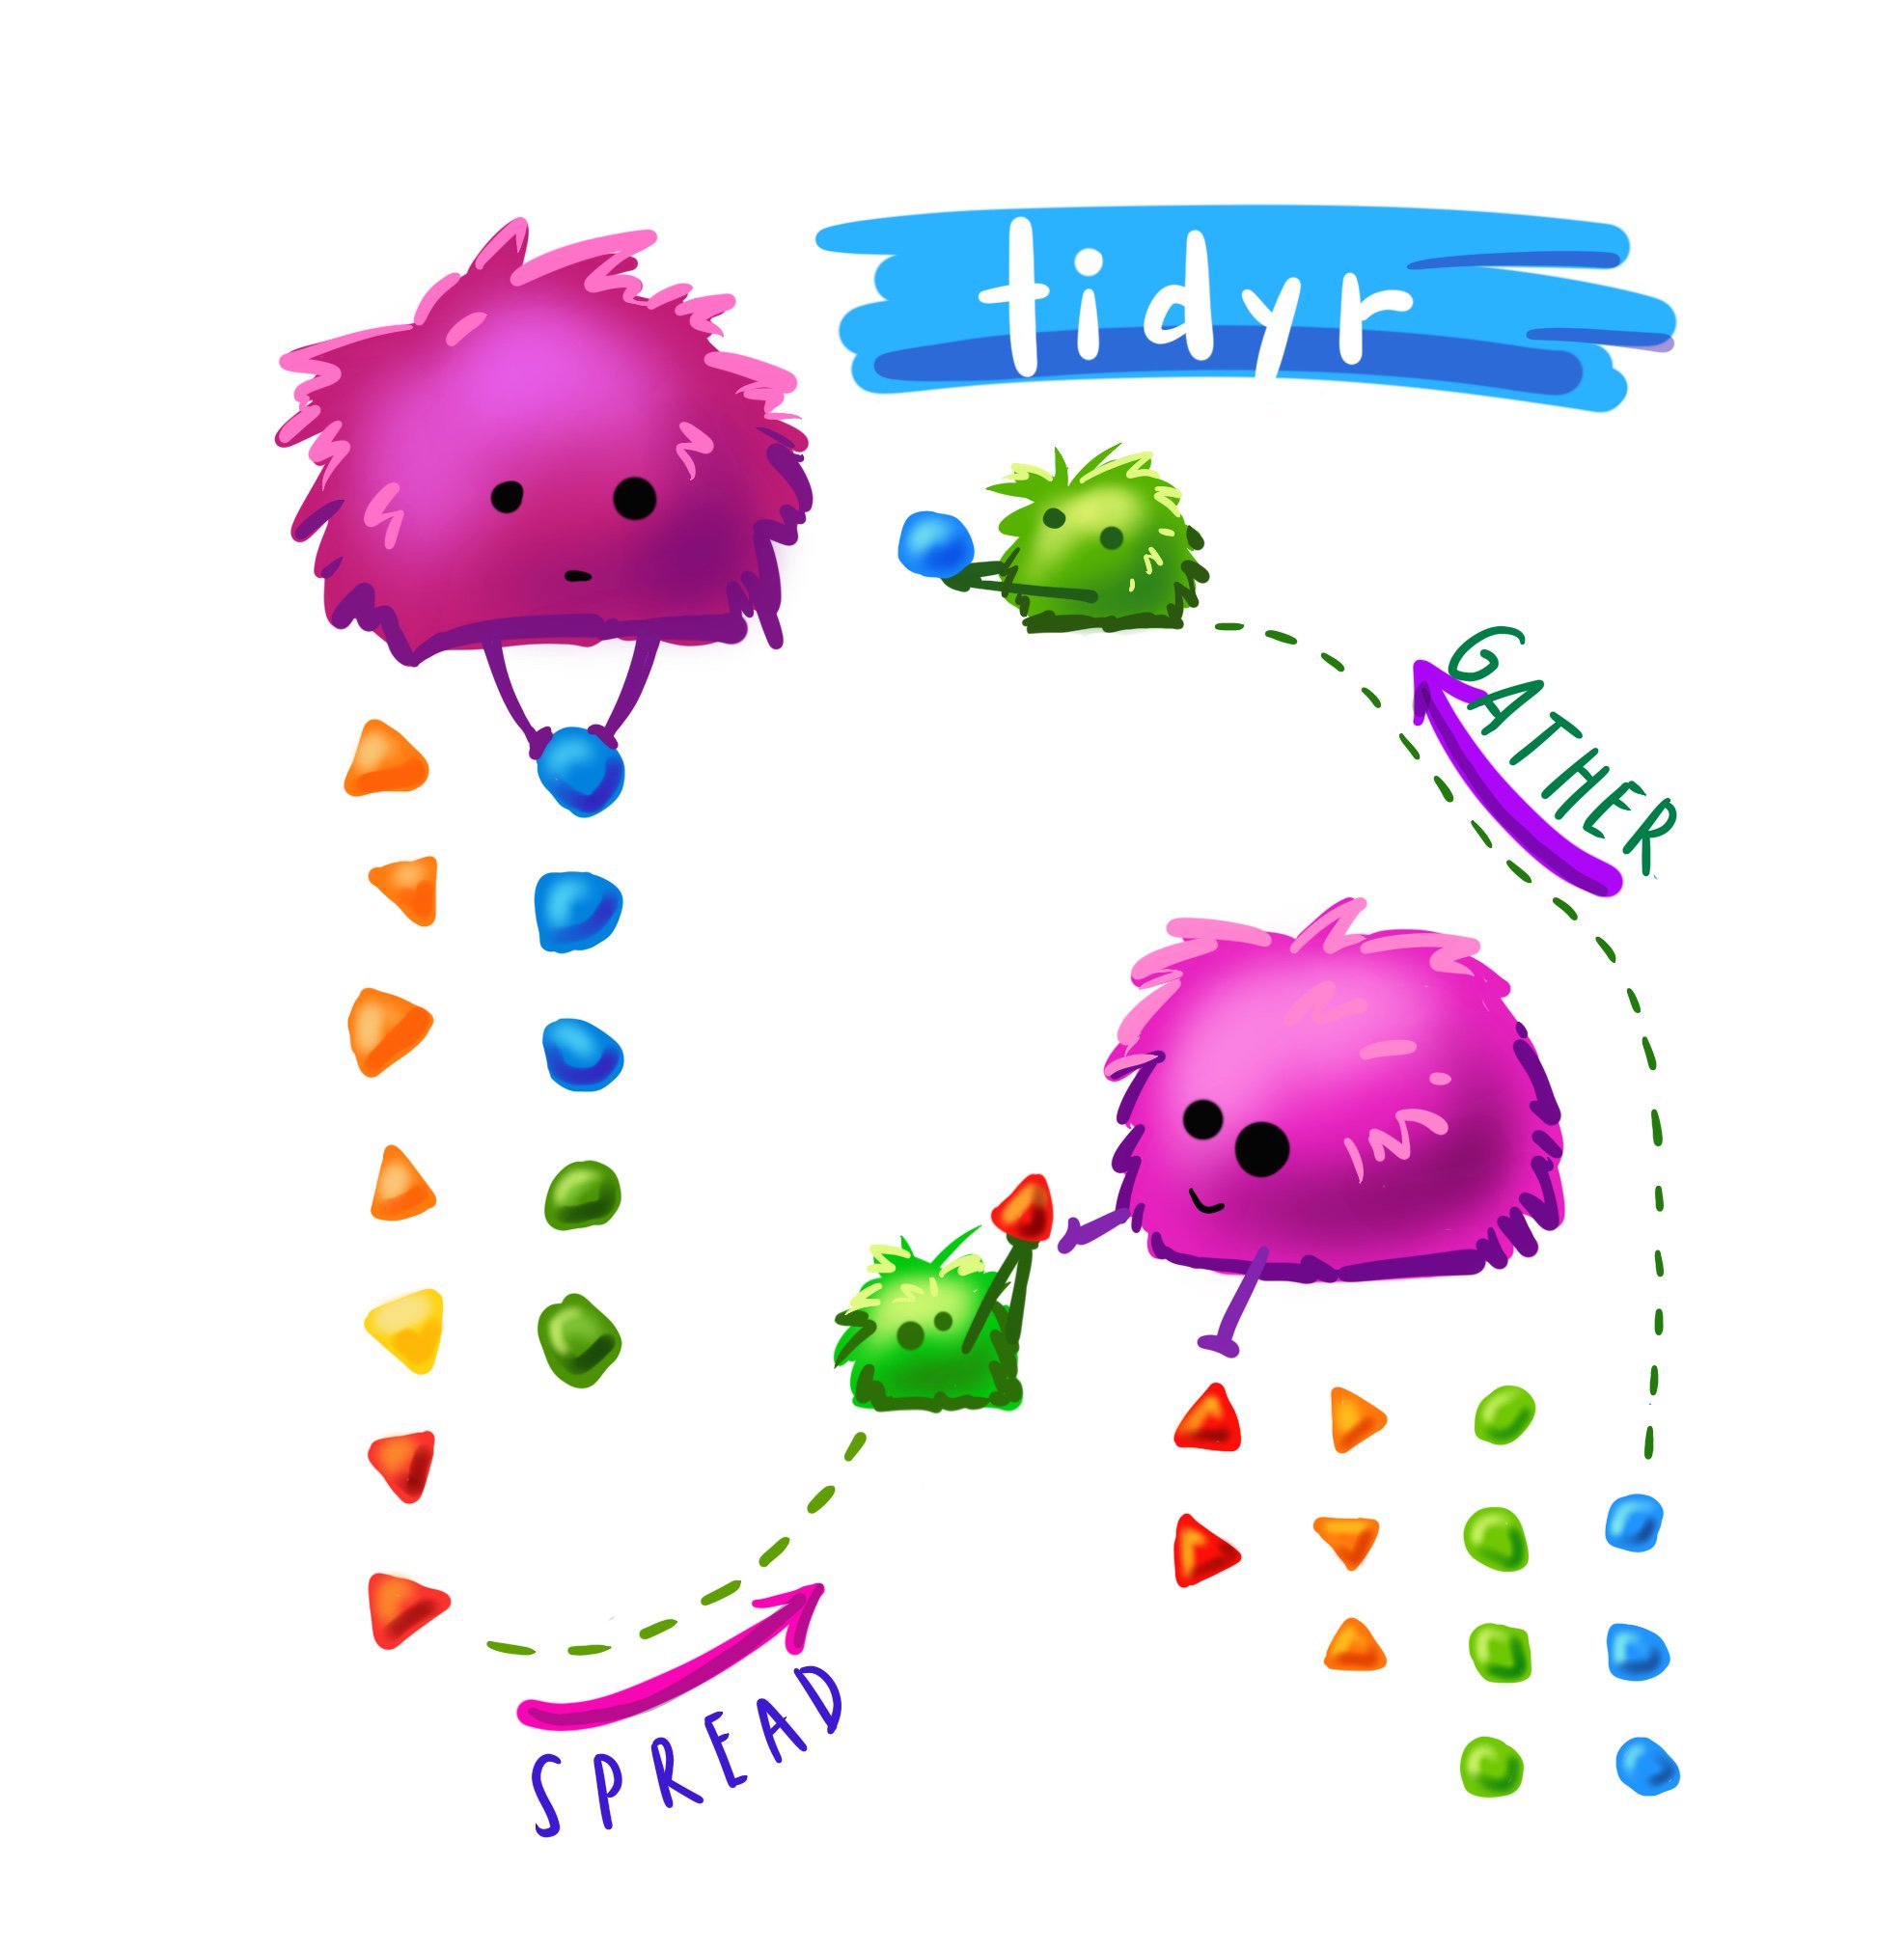
Credit to Allison Horst for the CUTE art.
In this lesson, we will use three different examples to illustrate how to use gather and spread to convert your data from wide to long and back to wide.
- Great British Bakeoff data from Alison Hill
- Some summary data from our own sydneybeaches dataset
- A wickedly complex example from a cognition experiment out of Dani Navarro’s lab
STOP THE PRESS
#RYouWithMe now has a data package! Check out https://ryouwithme.netlify.app/ for details about how to install and use the package to read the bakers, beach summary and frames data.
Each example is a little different, but in each case we can use gather and spread to do switch between different formats. We’ll walk you through the process step by step, but the basic idea is shown graphically in this lovely animation made by Garrick Aden-Buie.
Example 1: which bakers can identify spices?
Thanks to Alison Hill for sharing this example. This data is from a Great British Bakeoff challenge; I assume that bakers were tested on their ability to identify different spices.
The dataframe on the left is in wide format; the performance of each baker in each spice test is listed across different columns.
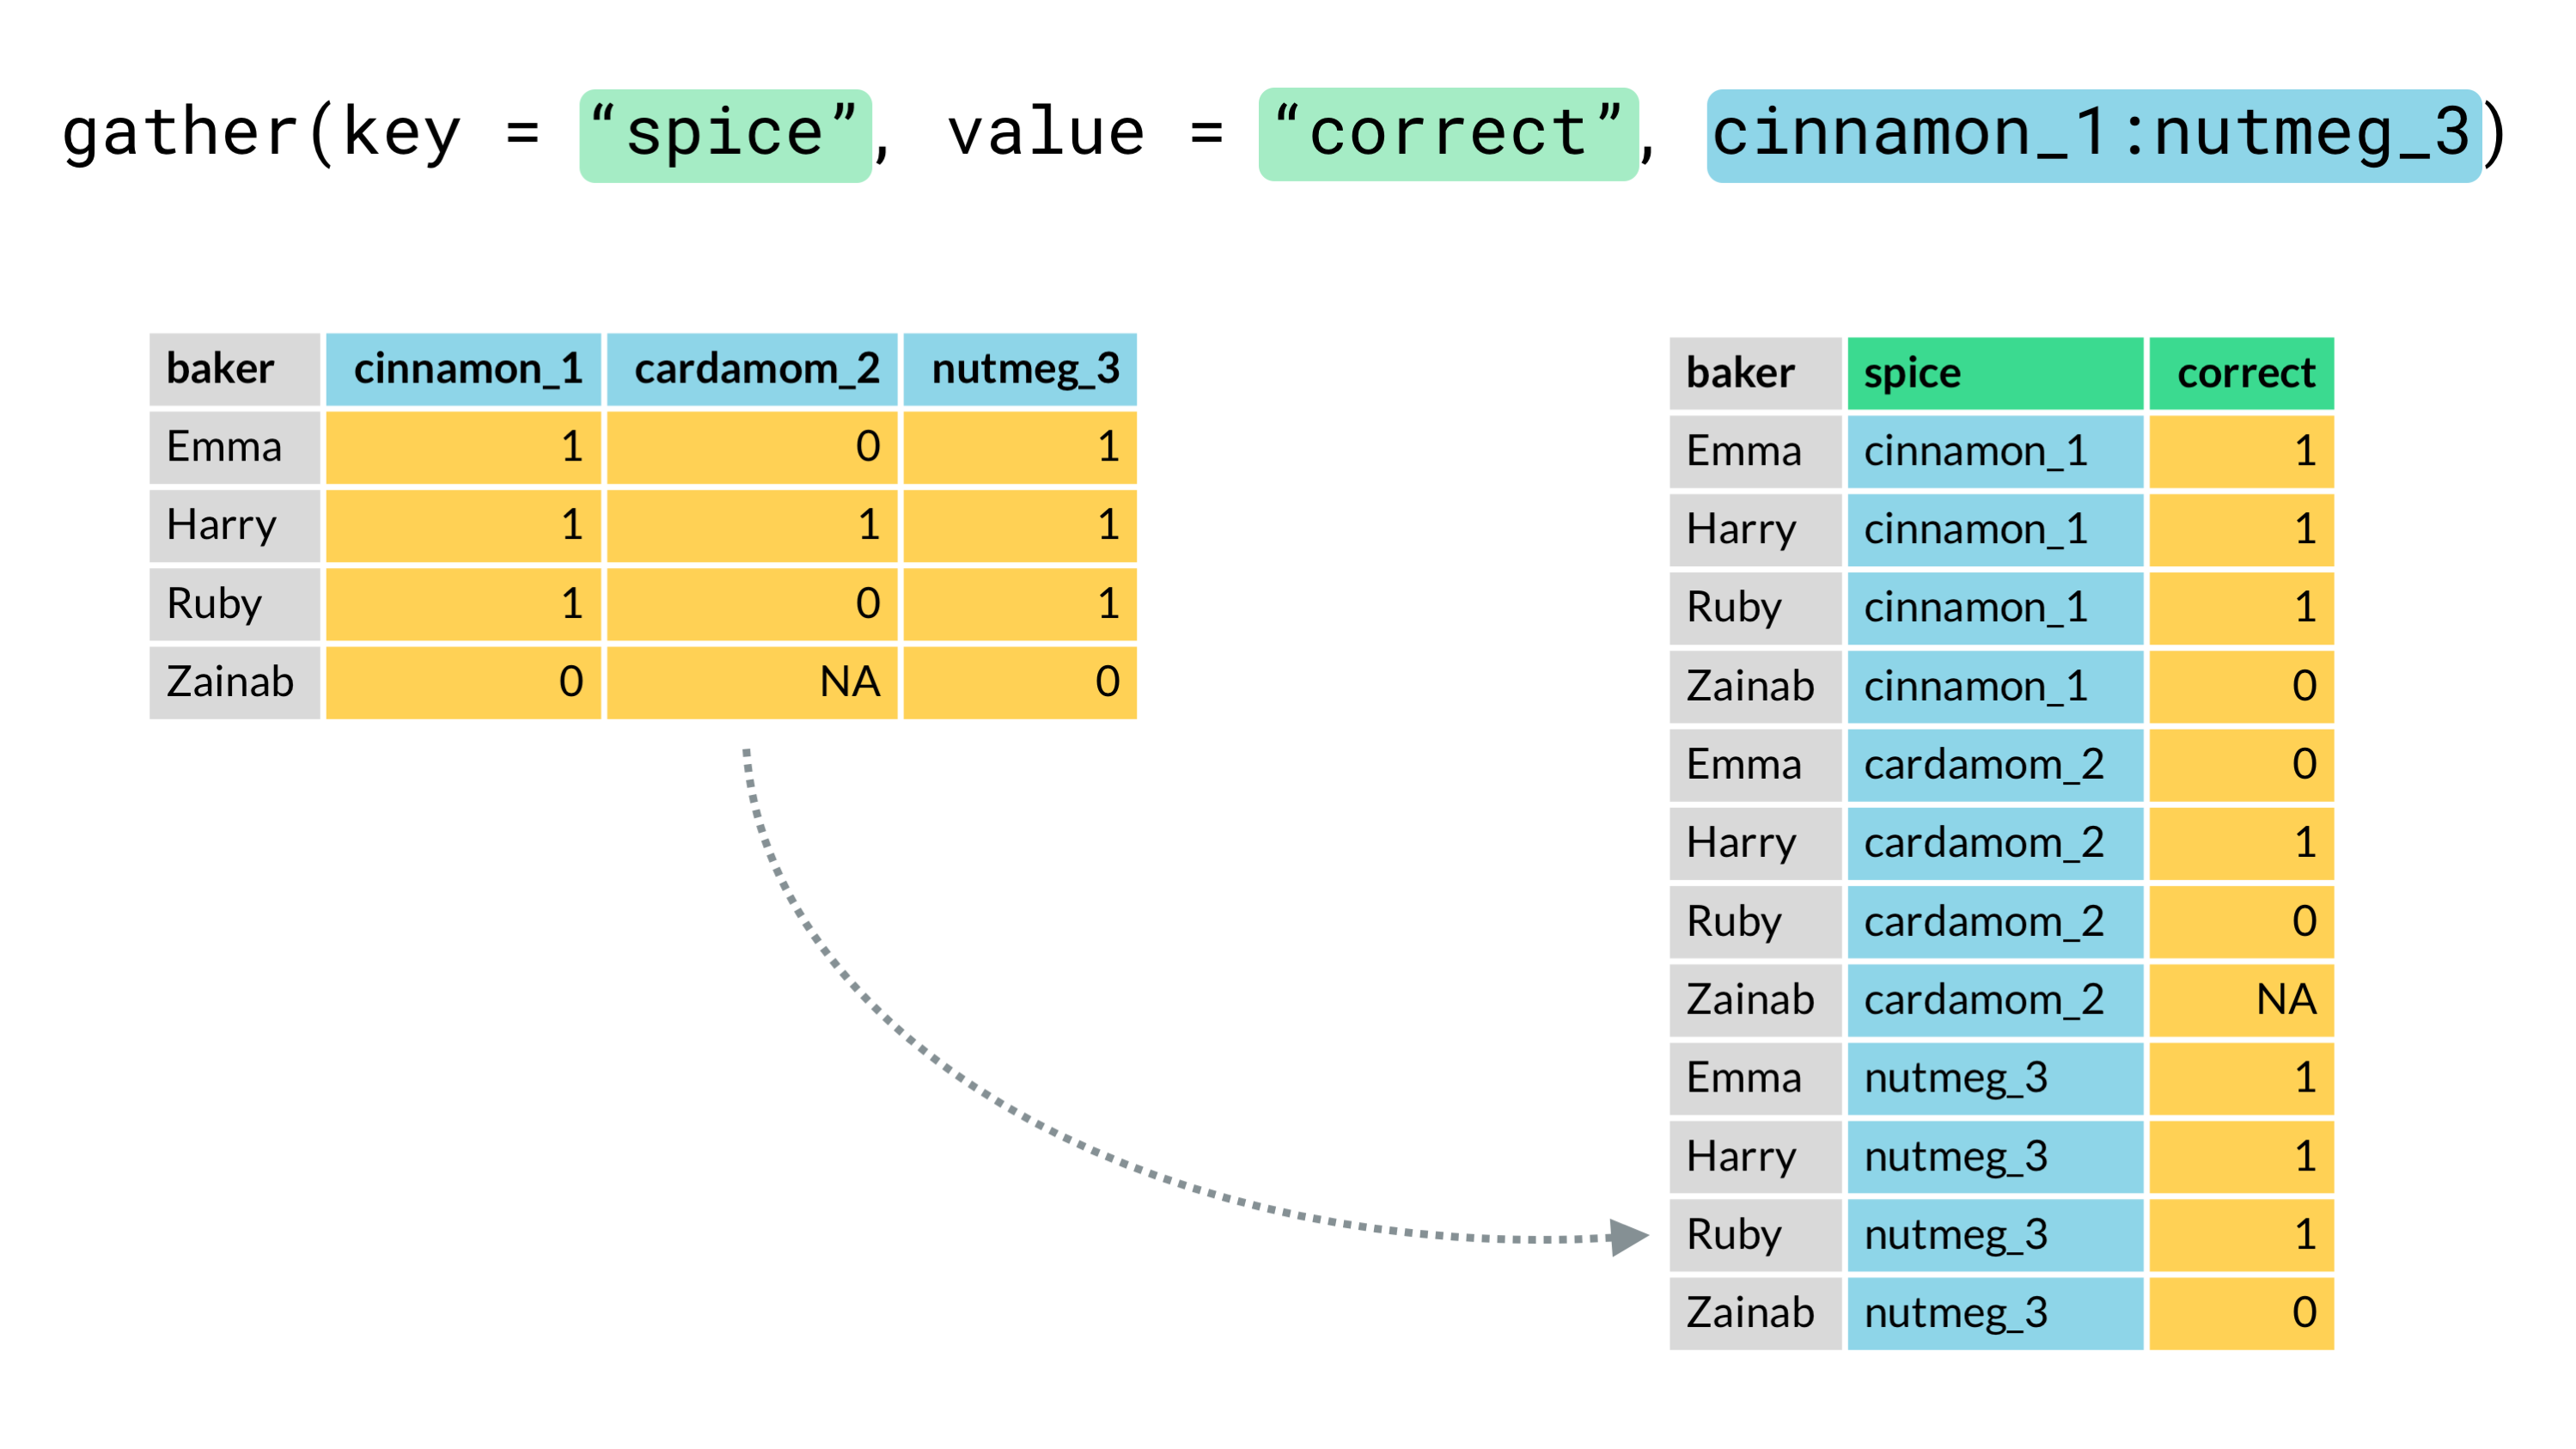 Image credit: Alison Hill
The dataframe on the right is in long format; all of the accuracy scores are in a single column and information about which baker and spice test each observation came from are represented in separate variables.
Using gather (wide to long)
The gather function will change your wide data to long format in a single line of code.
You need to tell it …
- data= dataframe you want to gather
- key = name of column you want to create to capture condition (i.e. spice)
- value = name of column you want to contain data values (i.e. correct)
- column X:column Y = range of columns that you have and want to gather (cinnamon_1:nutmeg_3)
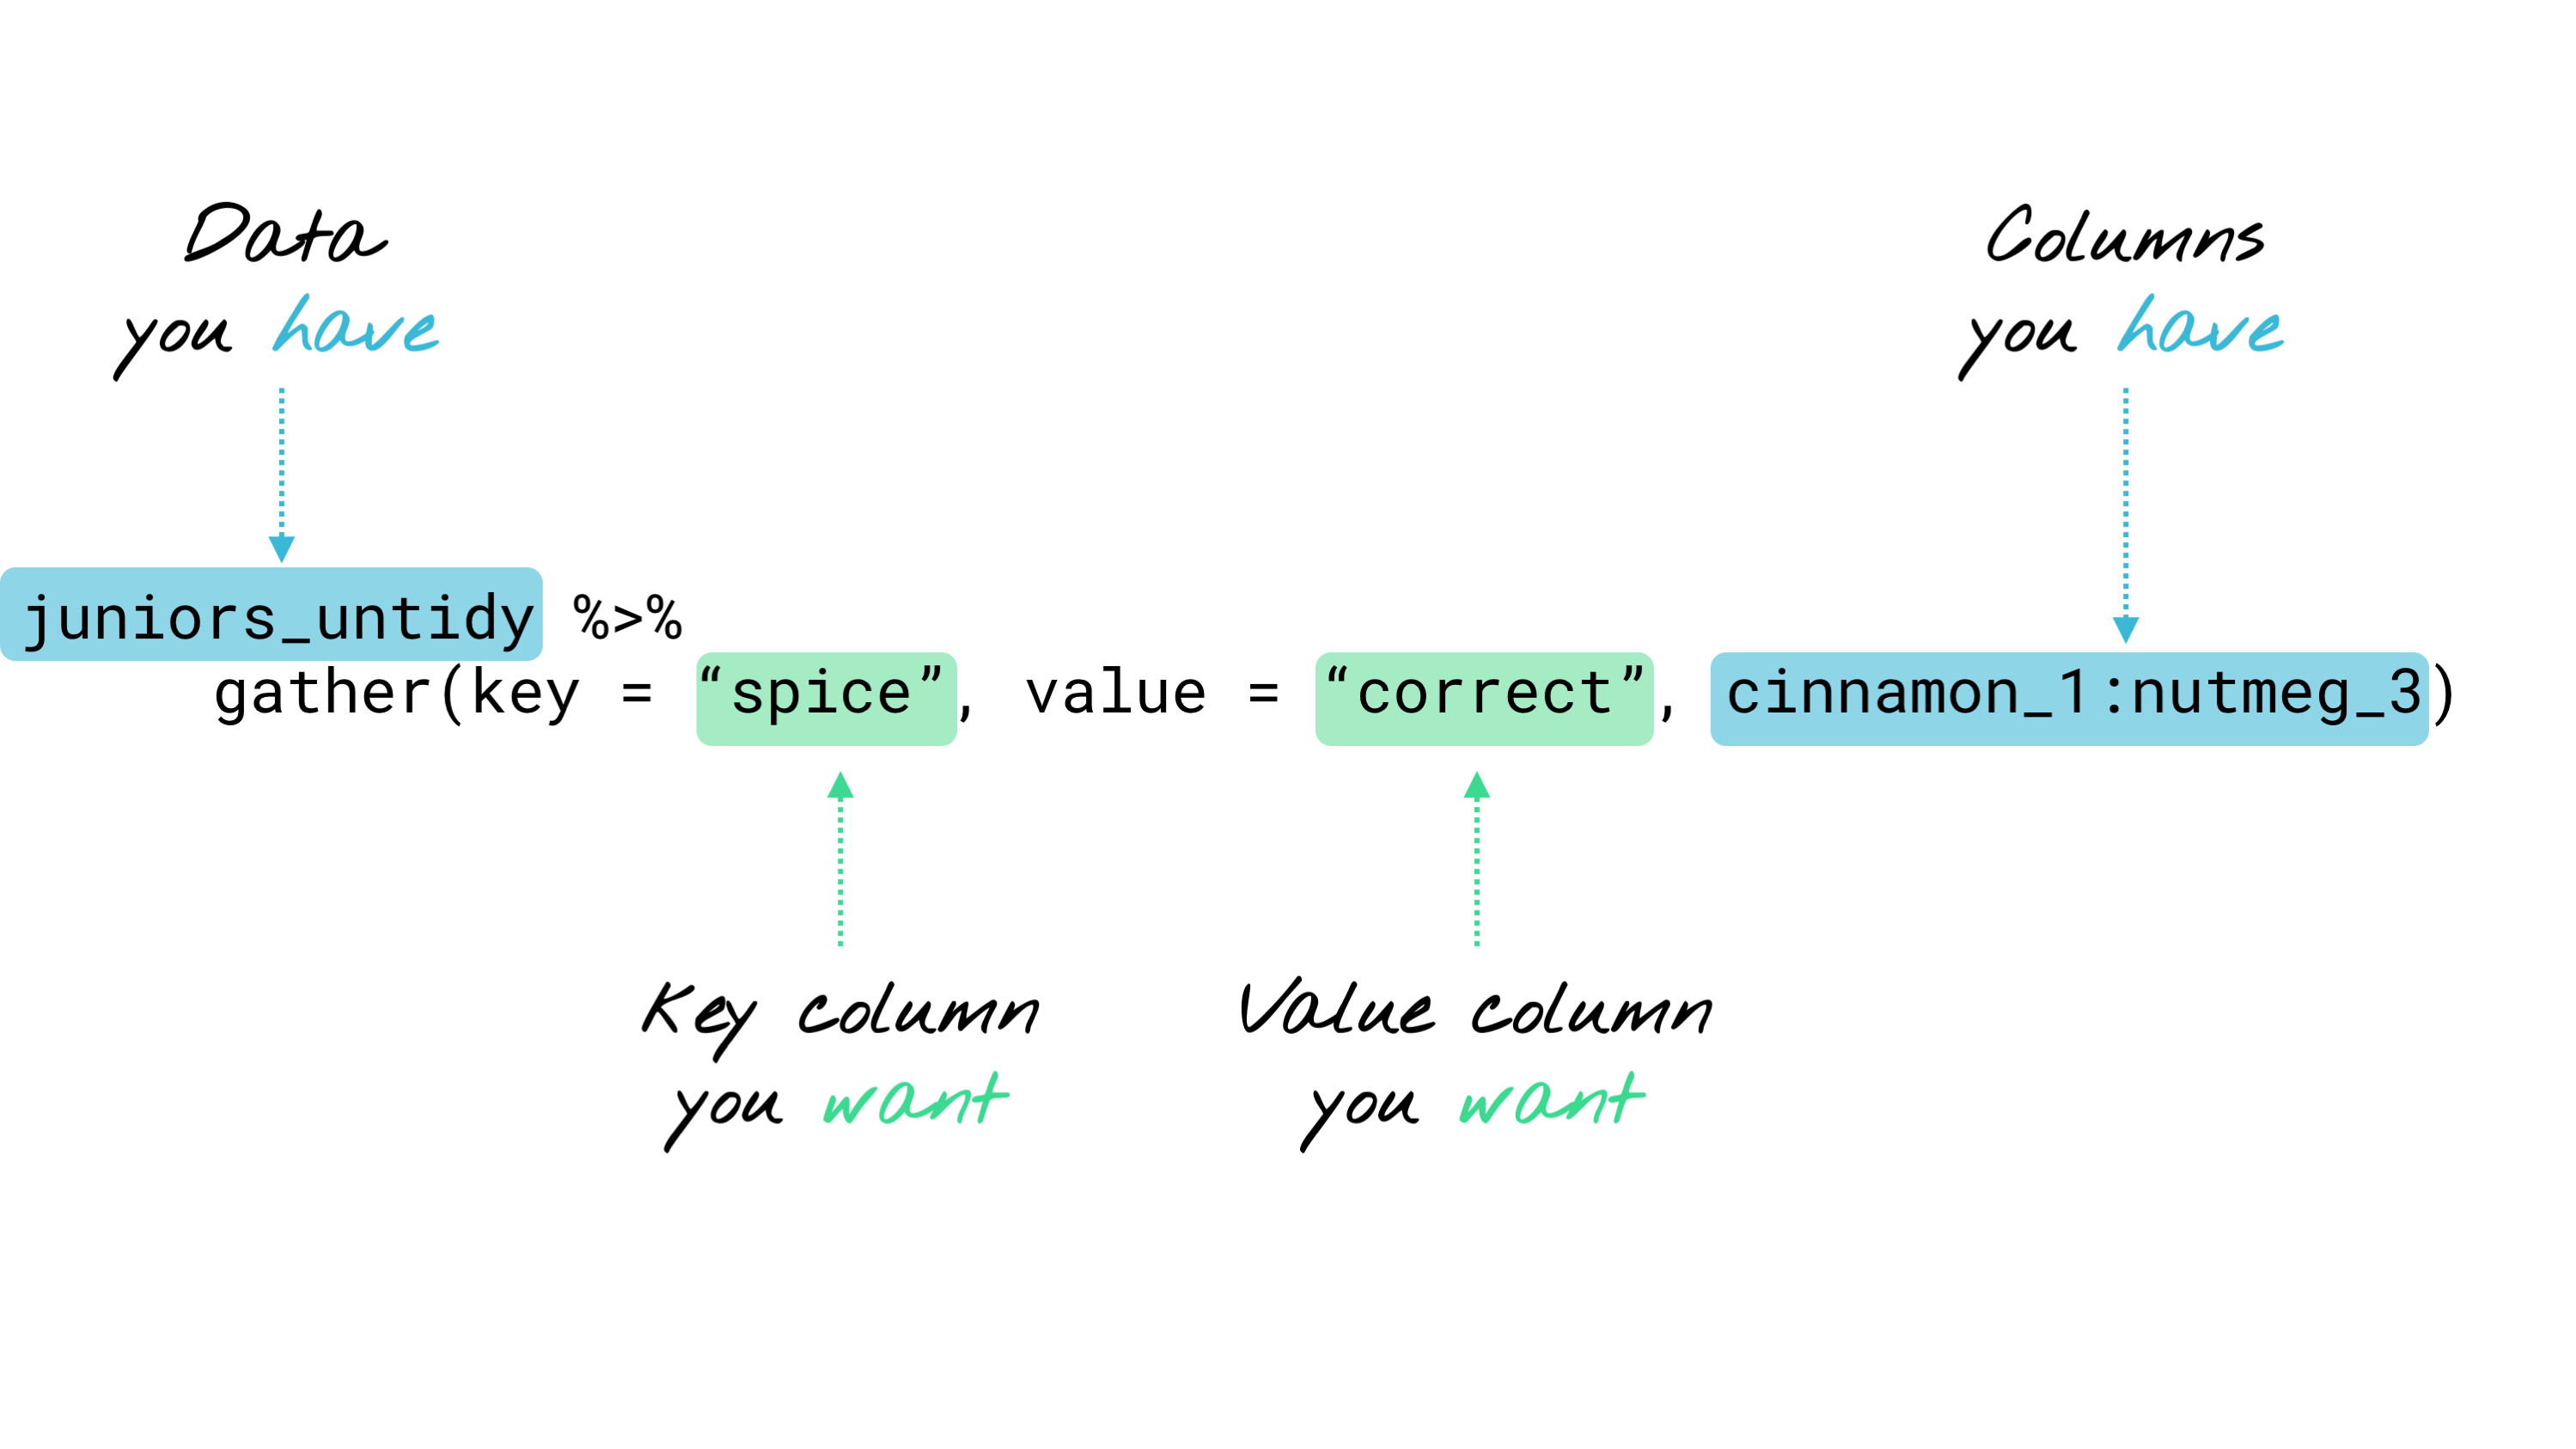 Image credit: Alison Hill
Using spread (long to wide)
The spread function will change your long data to wide format in a single line of code.
You need to tell it …
- data = dataframe you want to spread
- key = name of column you want to spread across several columns
- value = name of column that currently contains data values
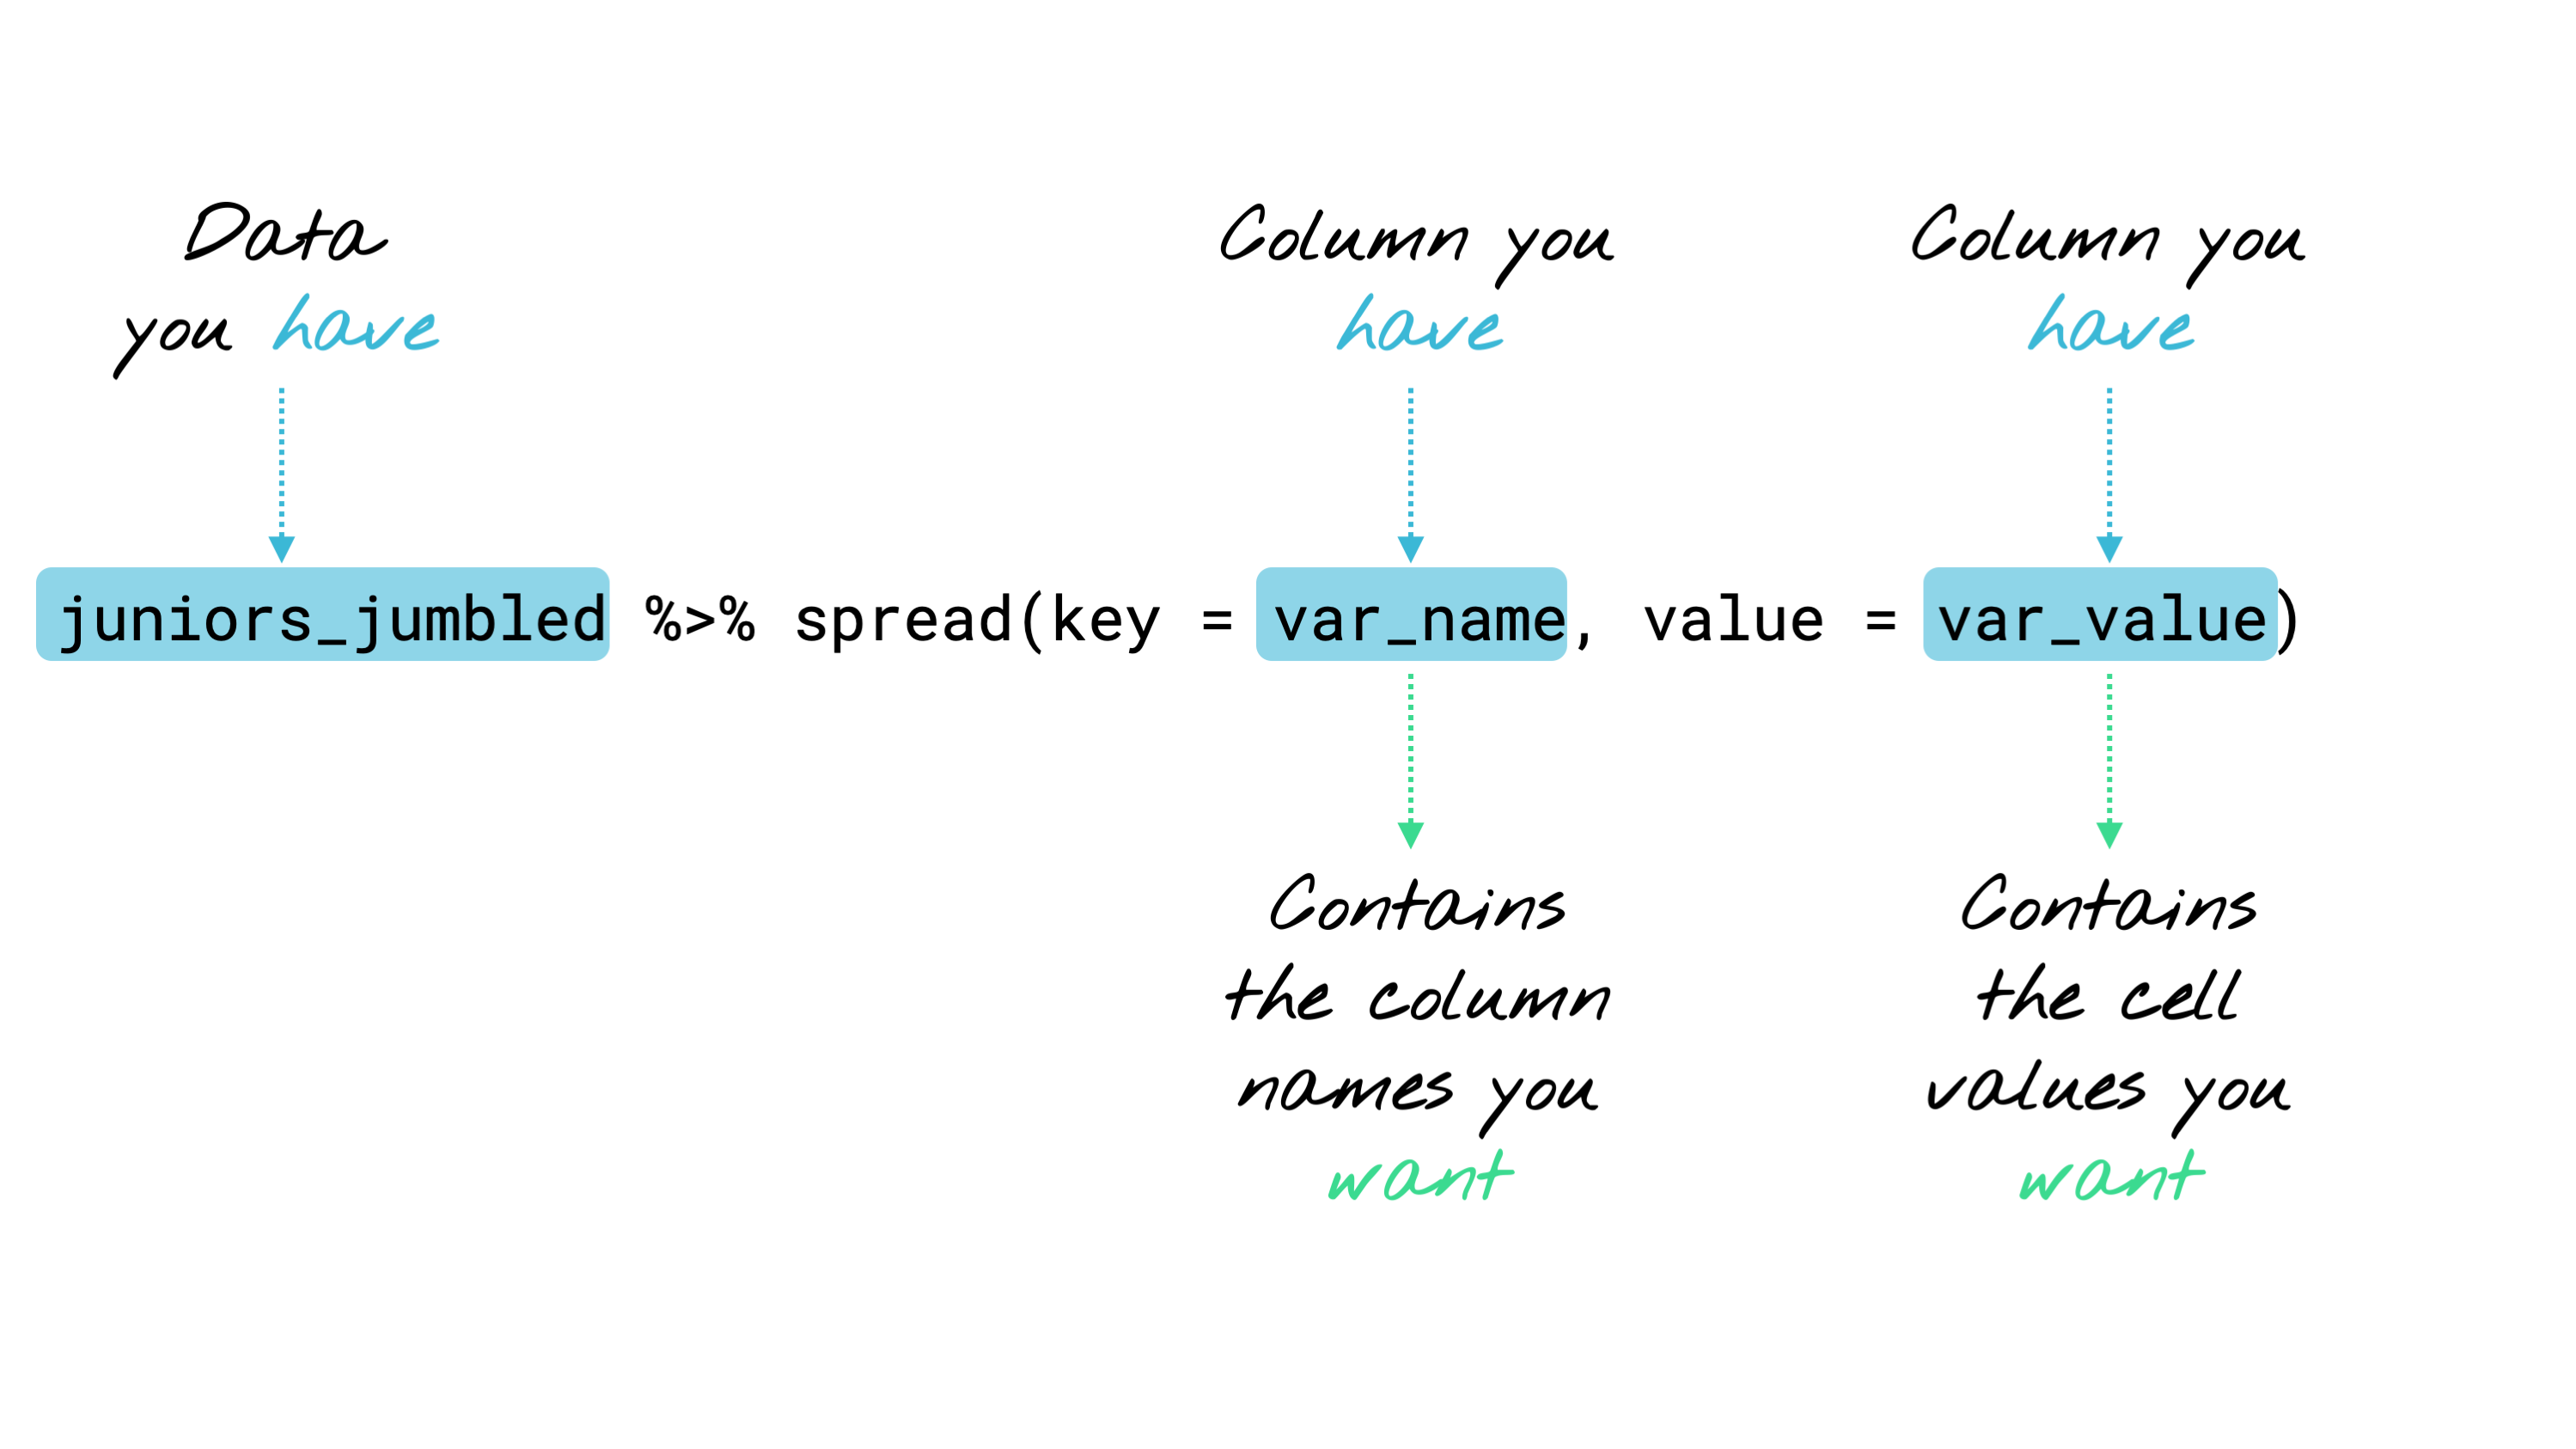 Image credit: Alison Hill
Your turn: Challenge 1
Here is a link to the bakers data in wide format.
- download the data and put it in your data folder
- open a new script
- load the tidyverse and here packages
- use
hereandread_csvto read the bakers data (go back to Basic Basics if you’ve forgotten how this works) - use
gatherto convert the bakers data from wide to long, replicating Alison’s steps above.
Example 2: long beaches are better than wide
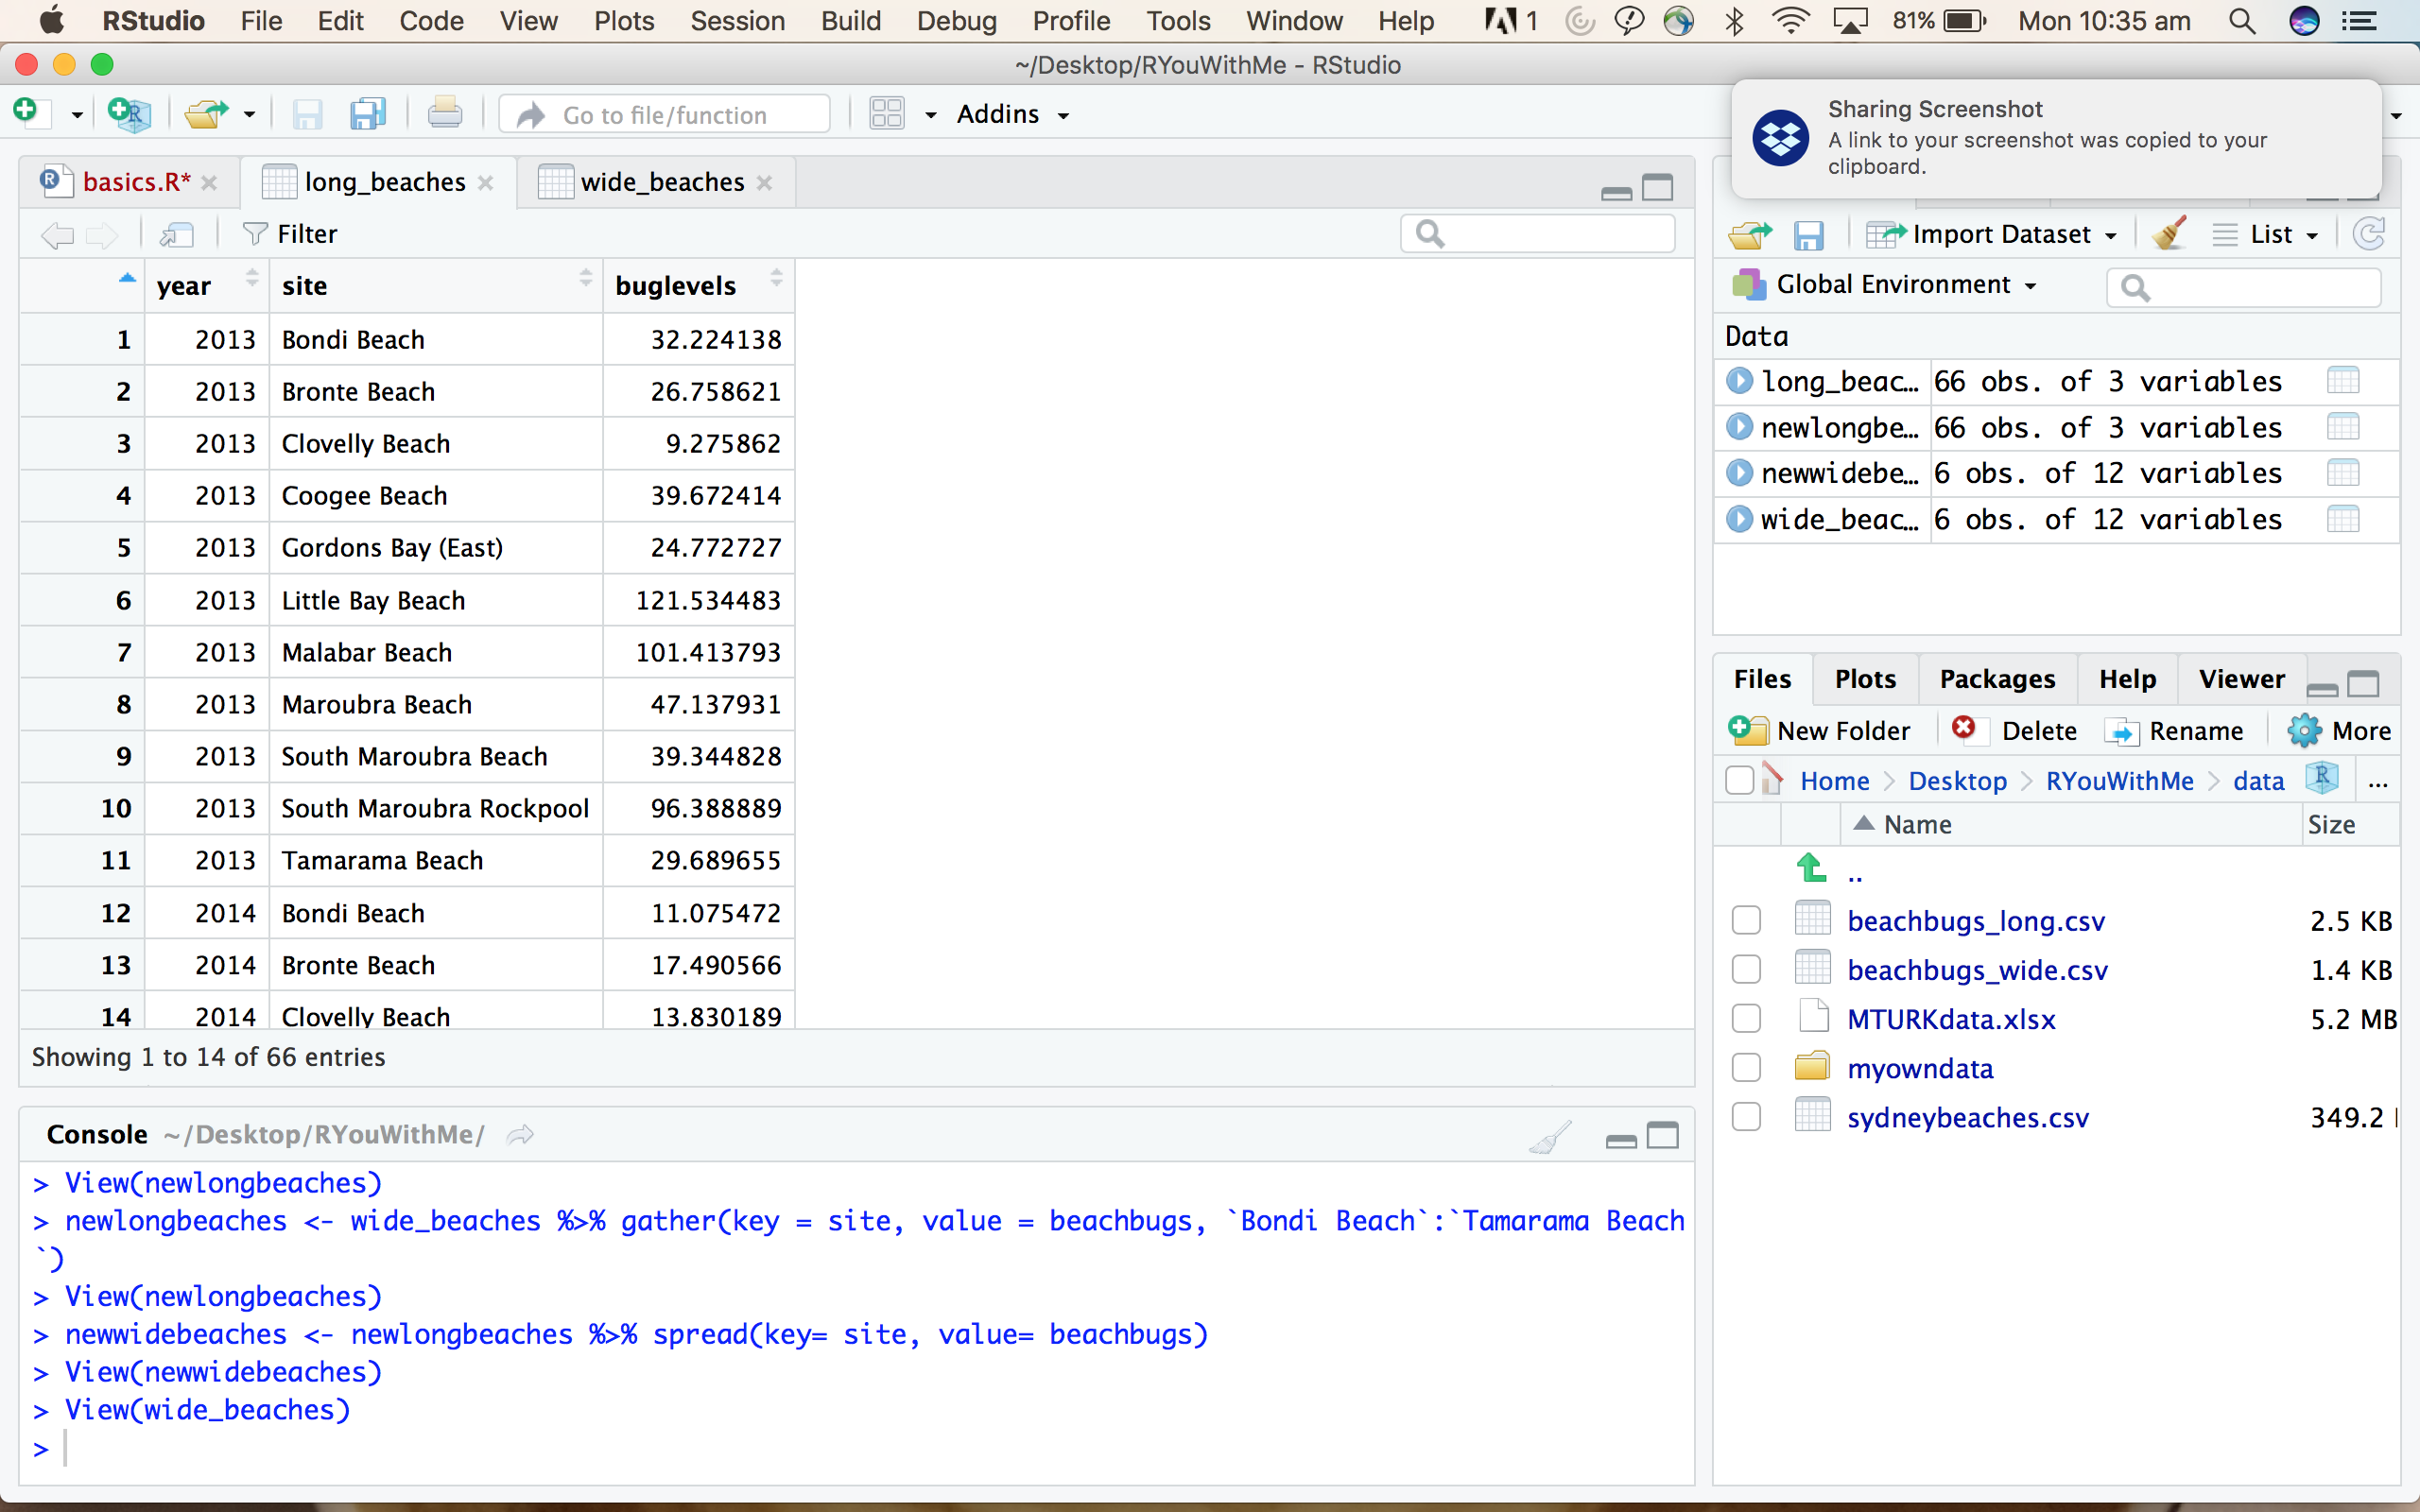
The raw sydneybeaches data is helpfully already in long format, but I have created a couple of summary datasets so we can practice changing data from wide to long and back again.
In the wide format, I’ve averaged bug levels for each year and the beach sites appear in separate columns.
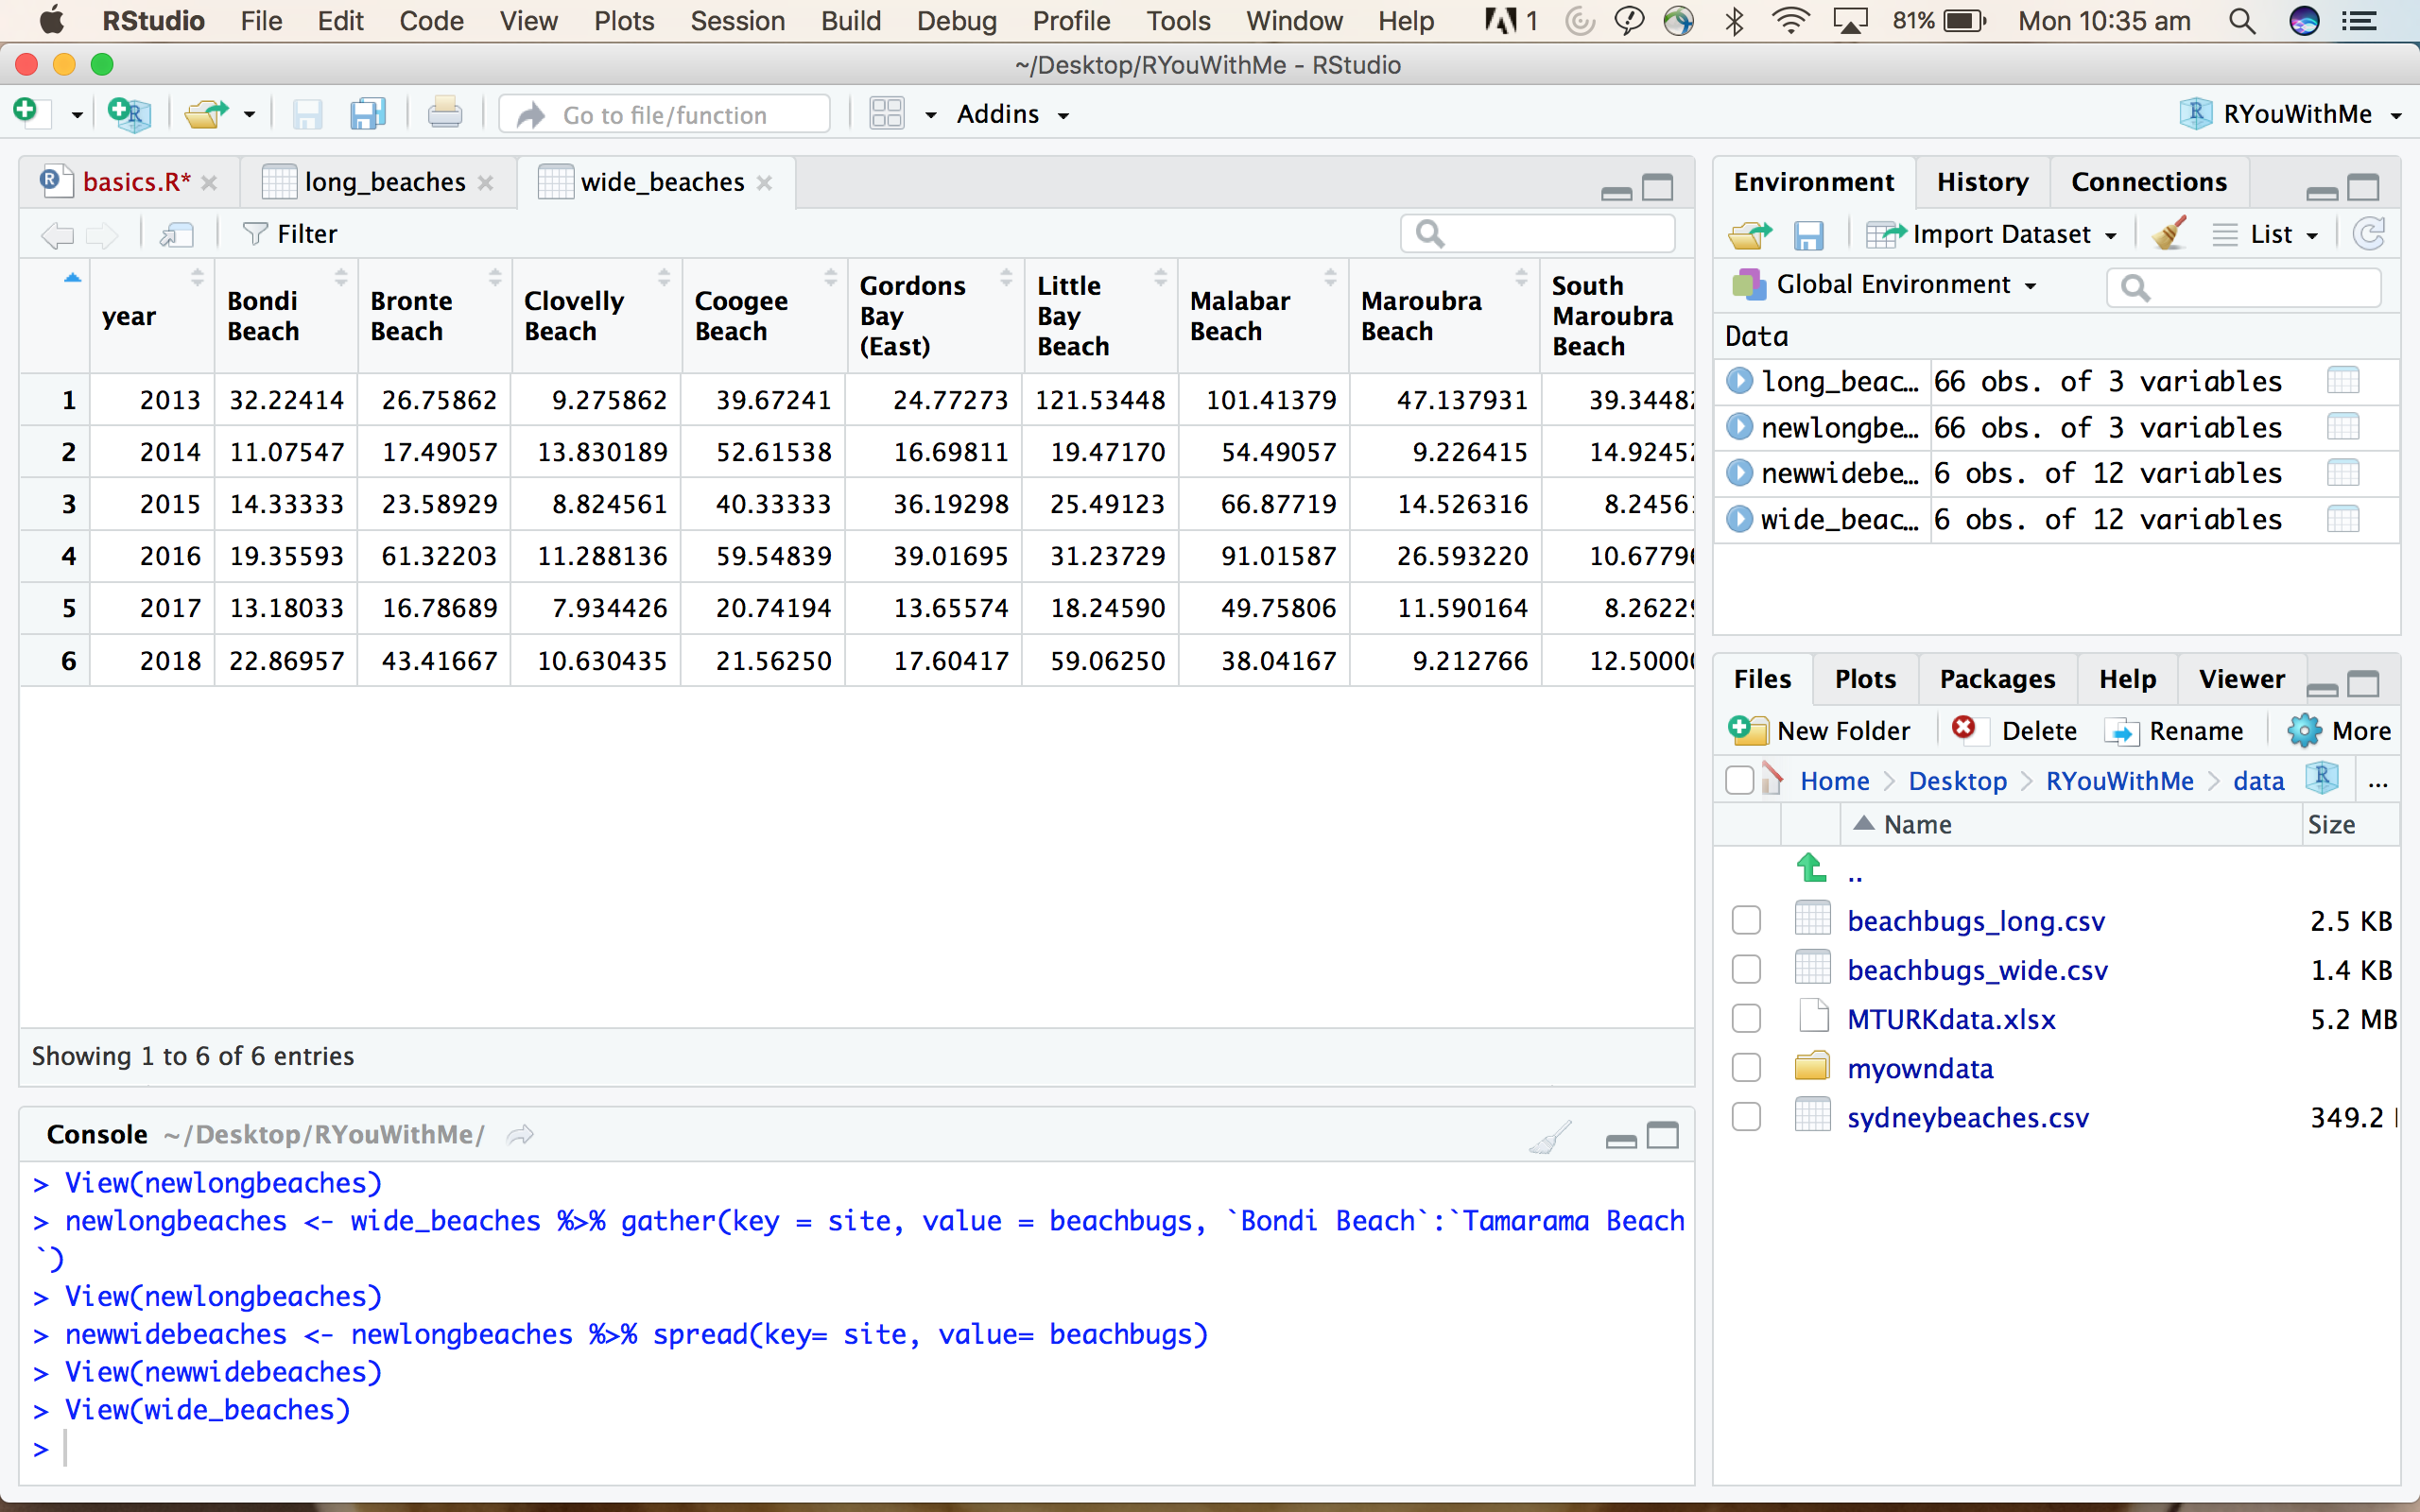
In long format, the bug levels from each site are all in a single column and year and site are represented as separate variables.
Your turn: Challenge 2
Here is a link to the beaches summary in wide format
- download the data and put it in your data folder
- open a new script
- load library tidyverse
- use
hereandread_csvto read the beaches data (go back to Basic Basics if you’ve forgotten how this works) - use
gatherto convert the beaches data from wide to long
In this screencast, I walk you through how to use gather and spread using the sydneybeaches data.
Example 3: A tricky one
The bakers data and beaches data are relatively simple. What happens if there is more that one condition that you are trying to gather across?
This sampling frames dataset comes from an experiment from Dani Navarro’s lab. In this study, each participant made reasoning judgements about items either based on a category or property (condition). They made repeated judgements after being given a small, medium, and large “samples” of information. For each of these sampling conditions, there were 7 different items that participants made a judgement about.
Here is what the data looks like in wide format.
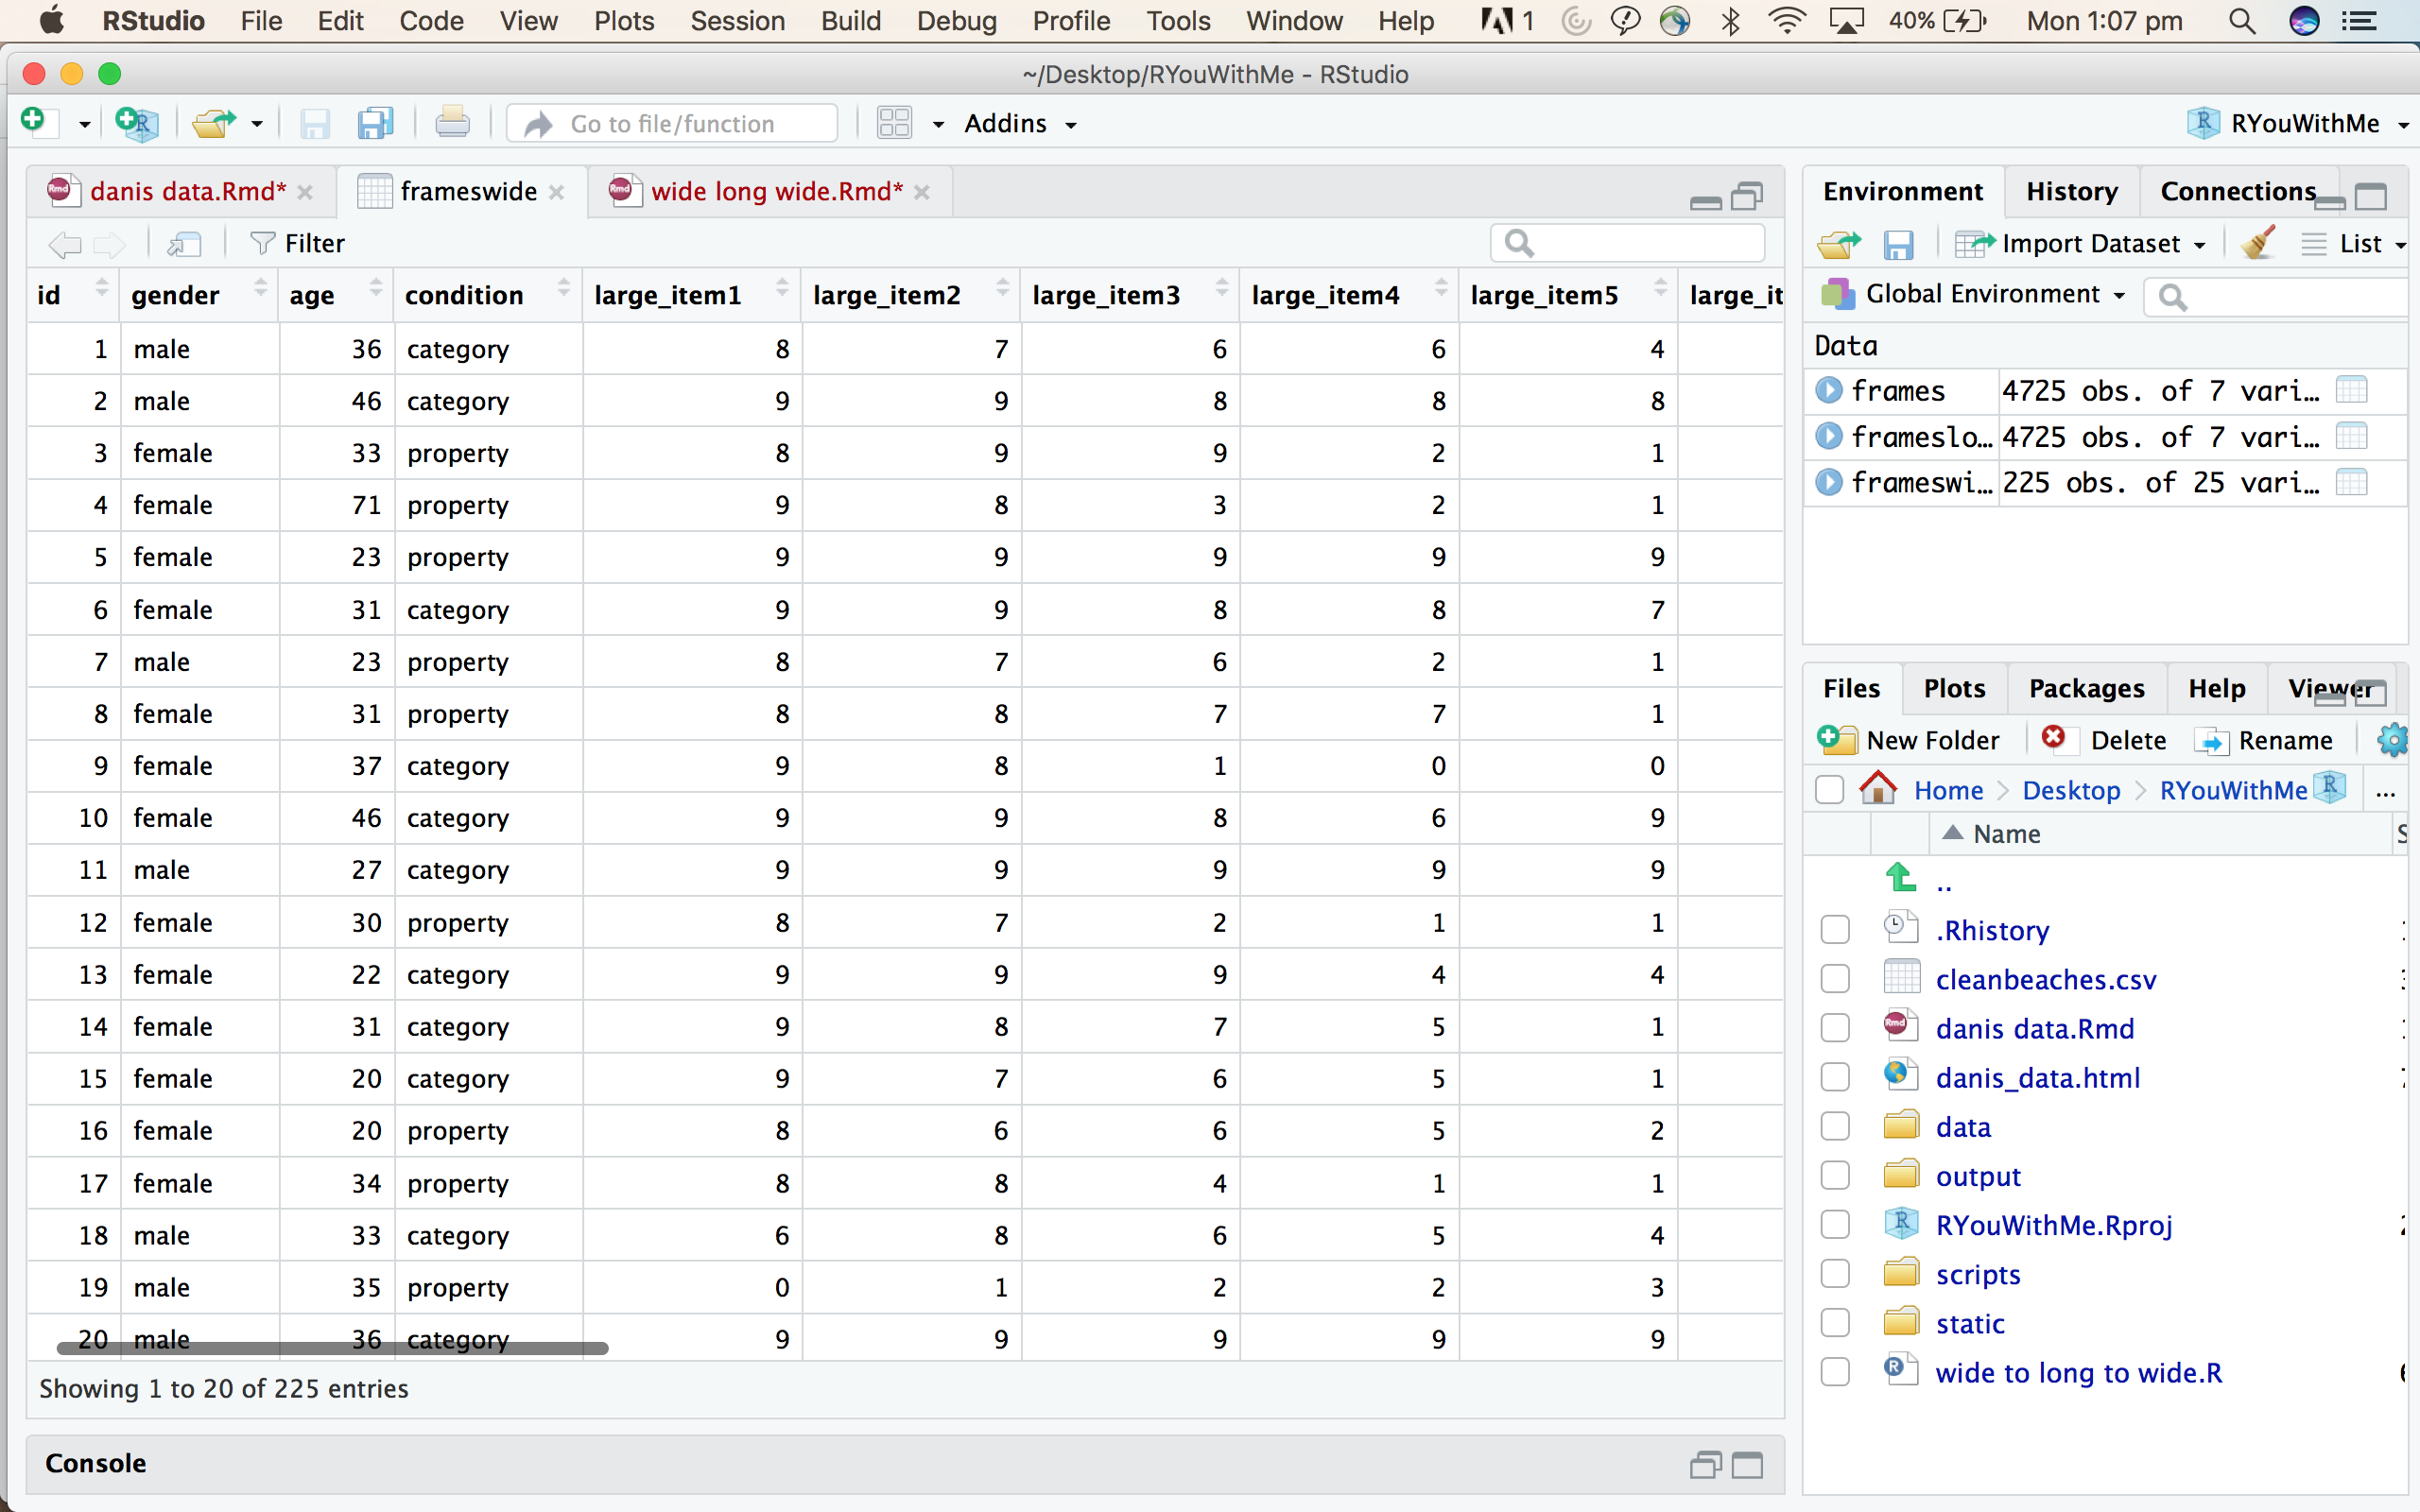
Each row contains all of the data from a single participant and the column represent information about BOTH sampling condition (small, medium, large) and item (1-7).
Your turn: Challenge 3.1
Here is a link to the frames data in wide format.
- download the data and put it in your data folder
- open a new script
- load the tidyverse and here packages
- use
hereandread_csvto read the frames data (go back to Basic Basics if you’ve forgotten how this works) - use
gatherto convert the frames data from wide to long
How did you go?
Hopefully you ended up with a data frame that looks something like this.
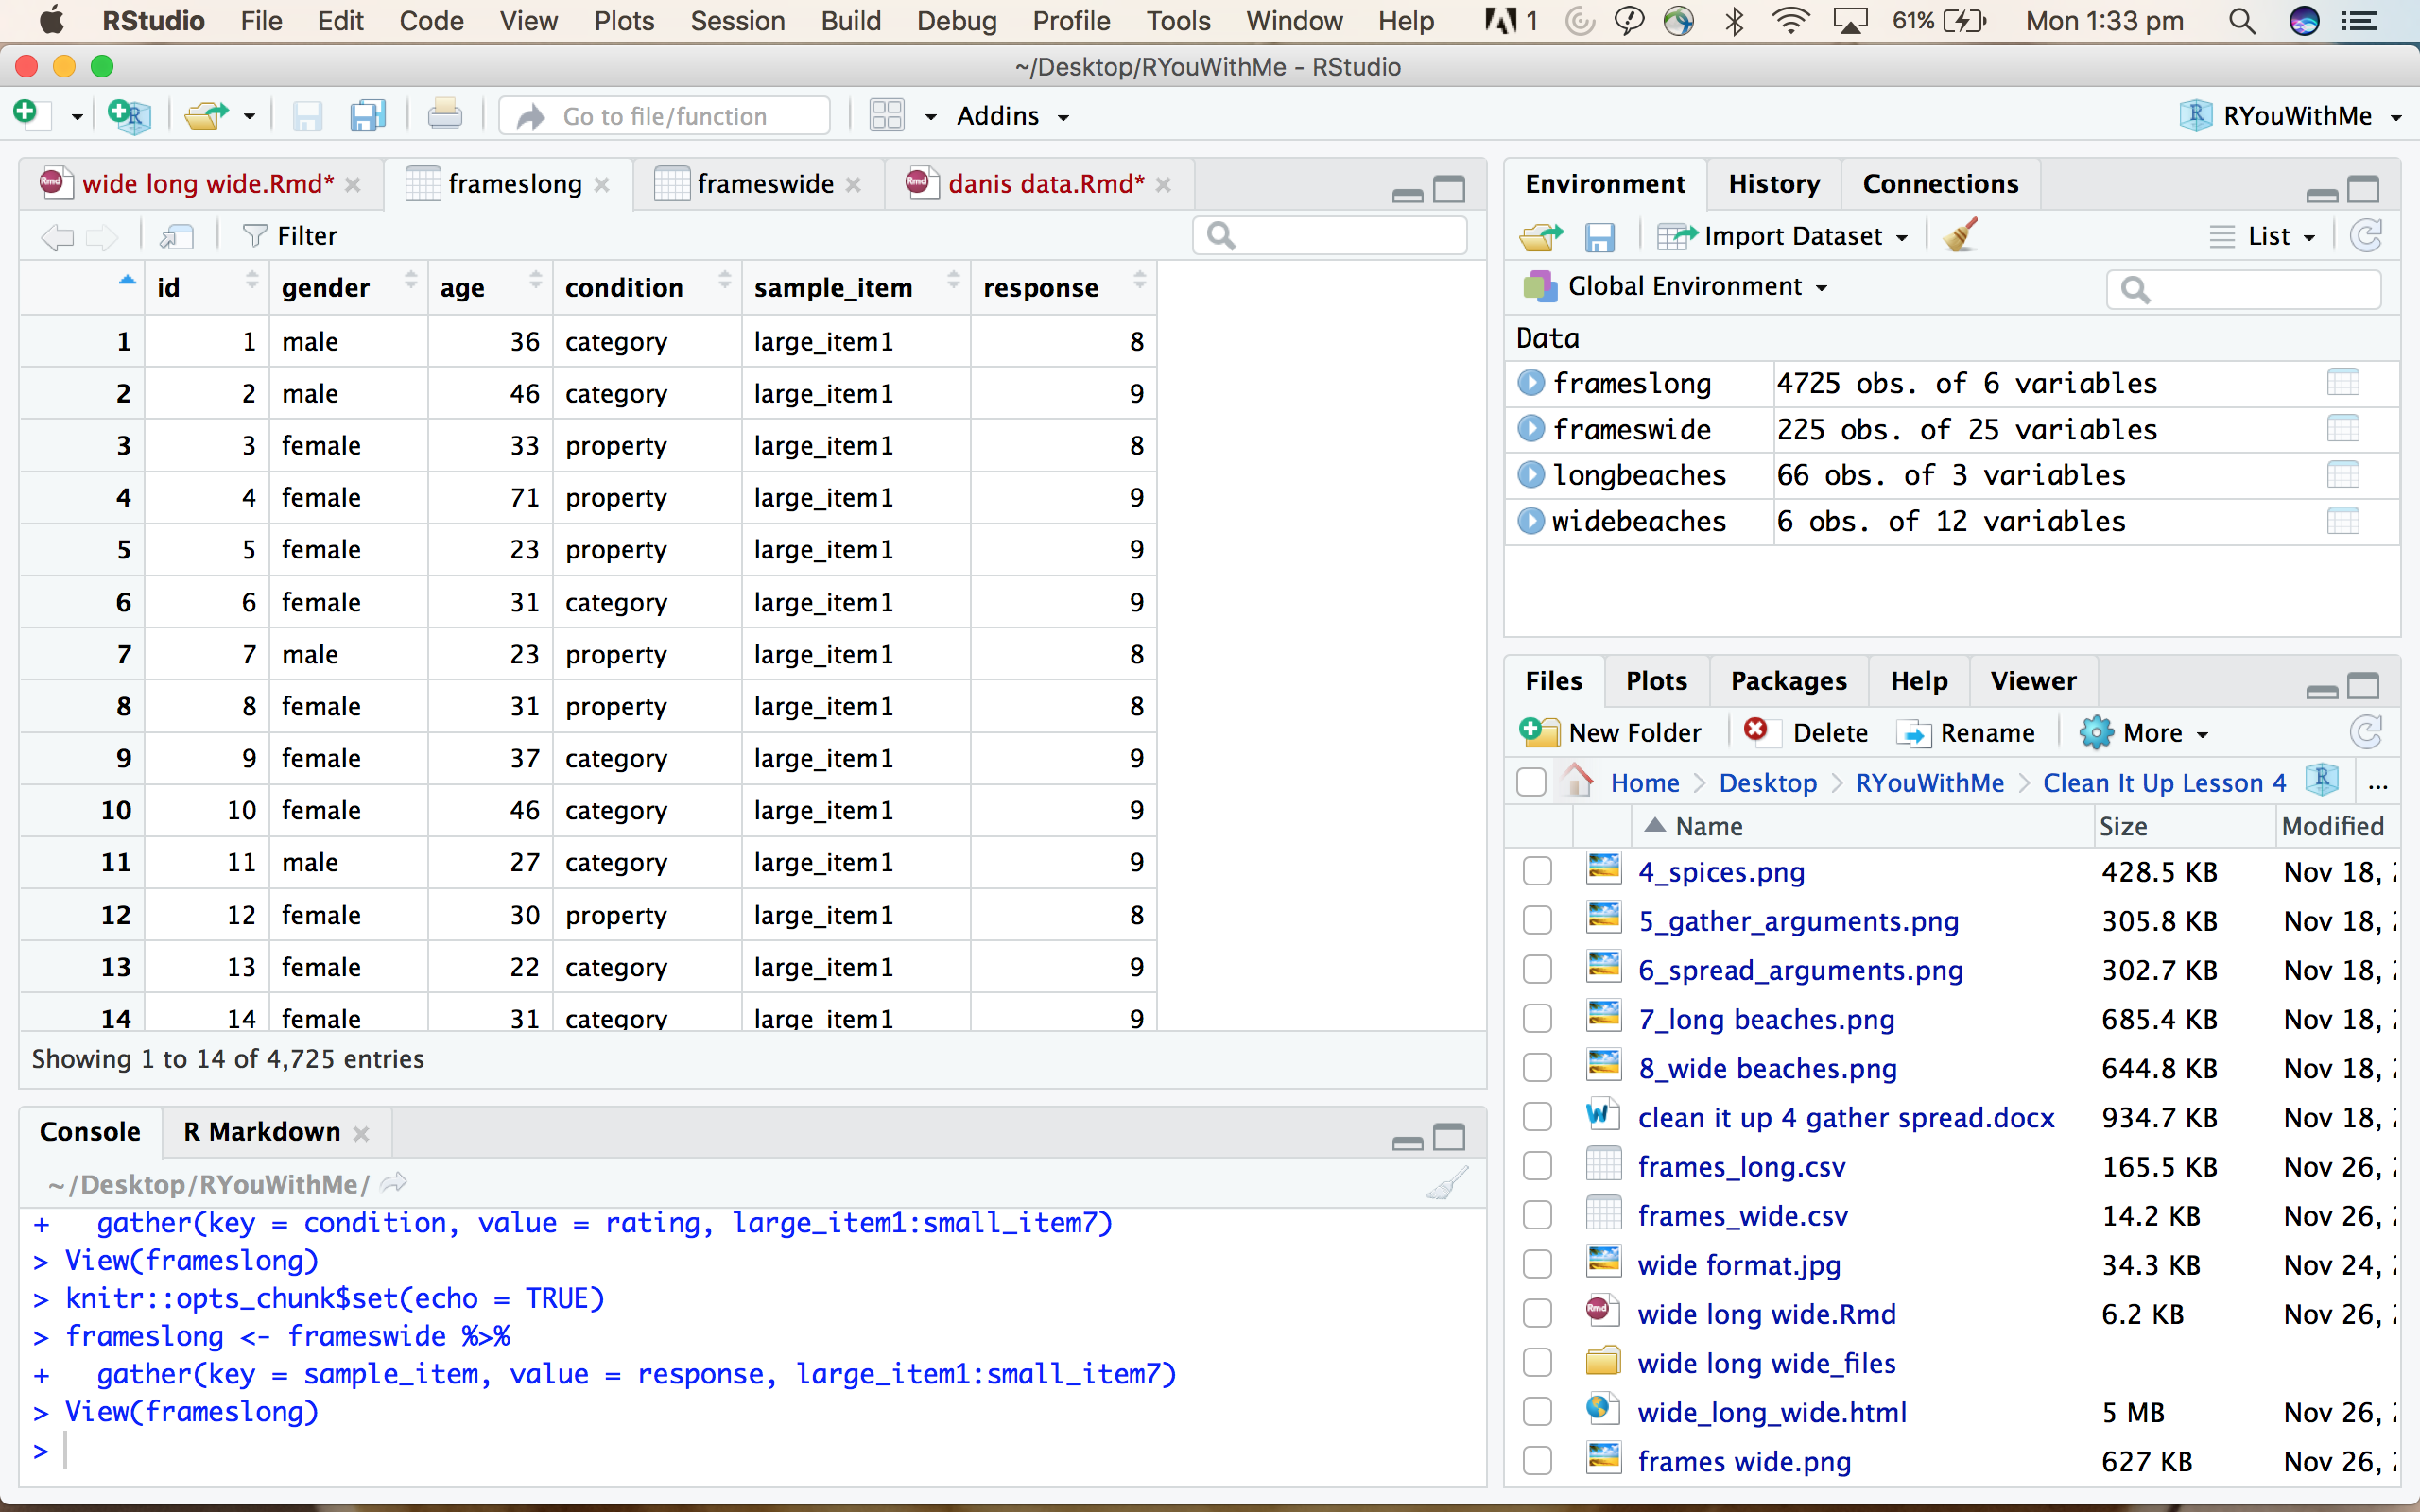
Unfortunately though, your work is not done. See how we now have all the ratings in a single column called response, but the “key” column that you created contains information about both the sampling frame AND the item. For the data to be truly tidy, we need that information split into two separate variables.
Your turn: Challenge 3.2
Go back to Clean It Up 3 and brush up on the separate function.
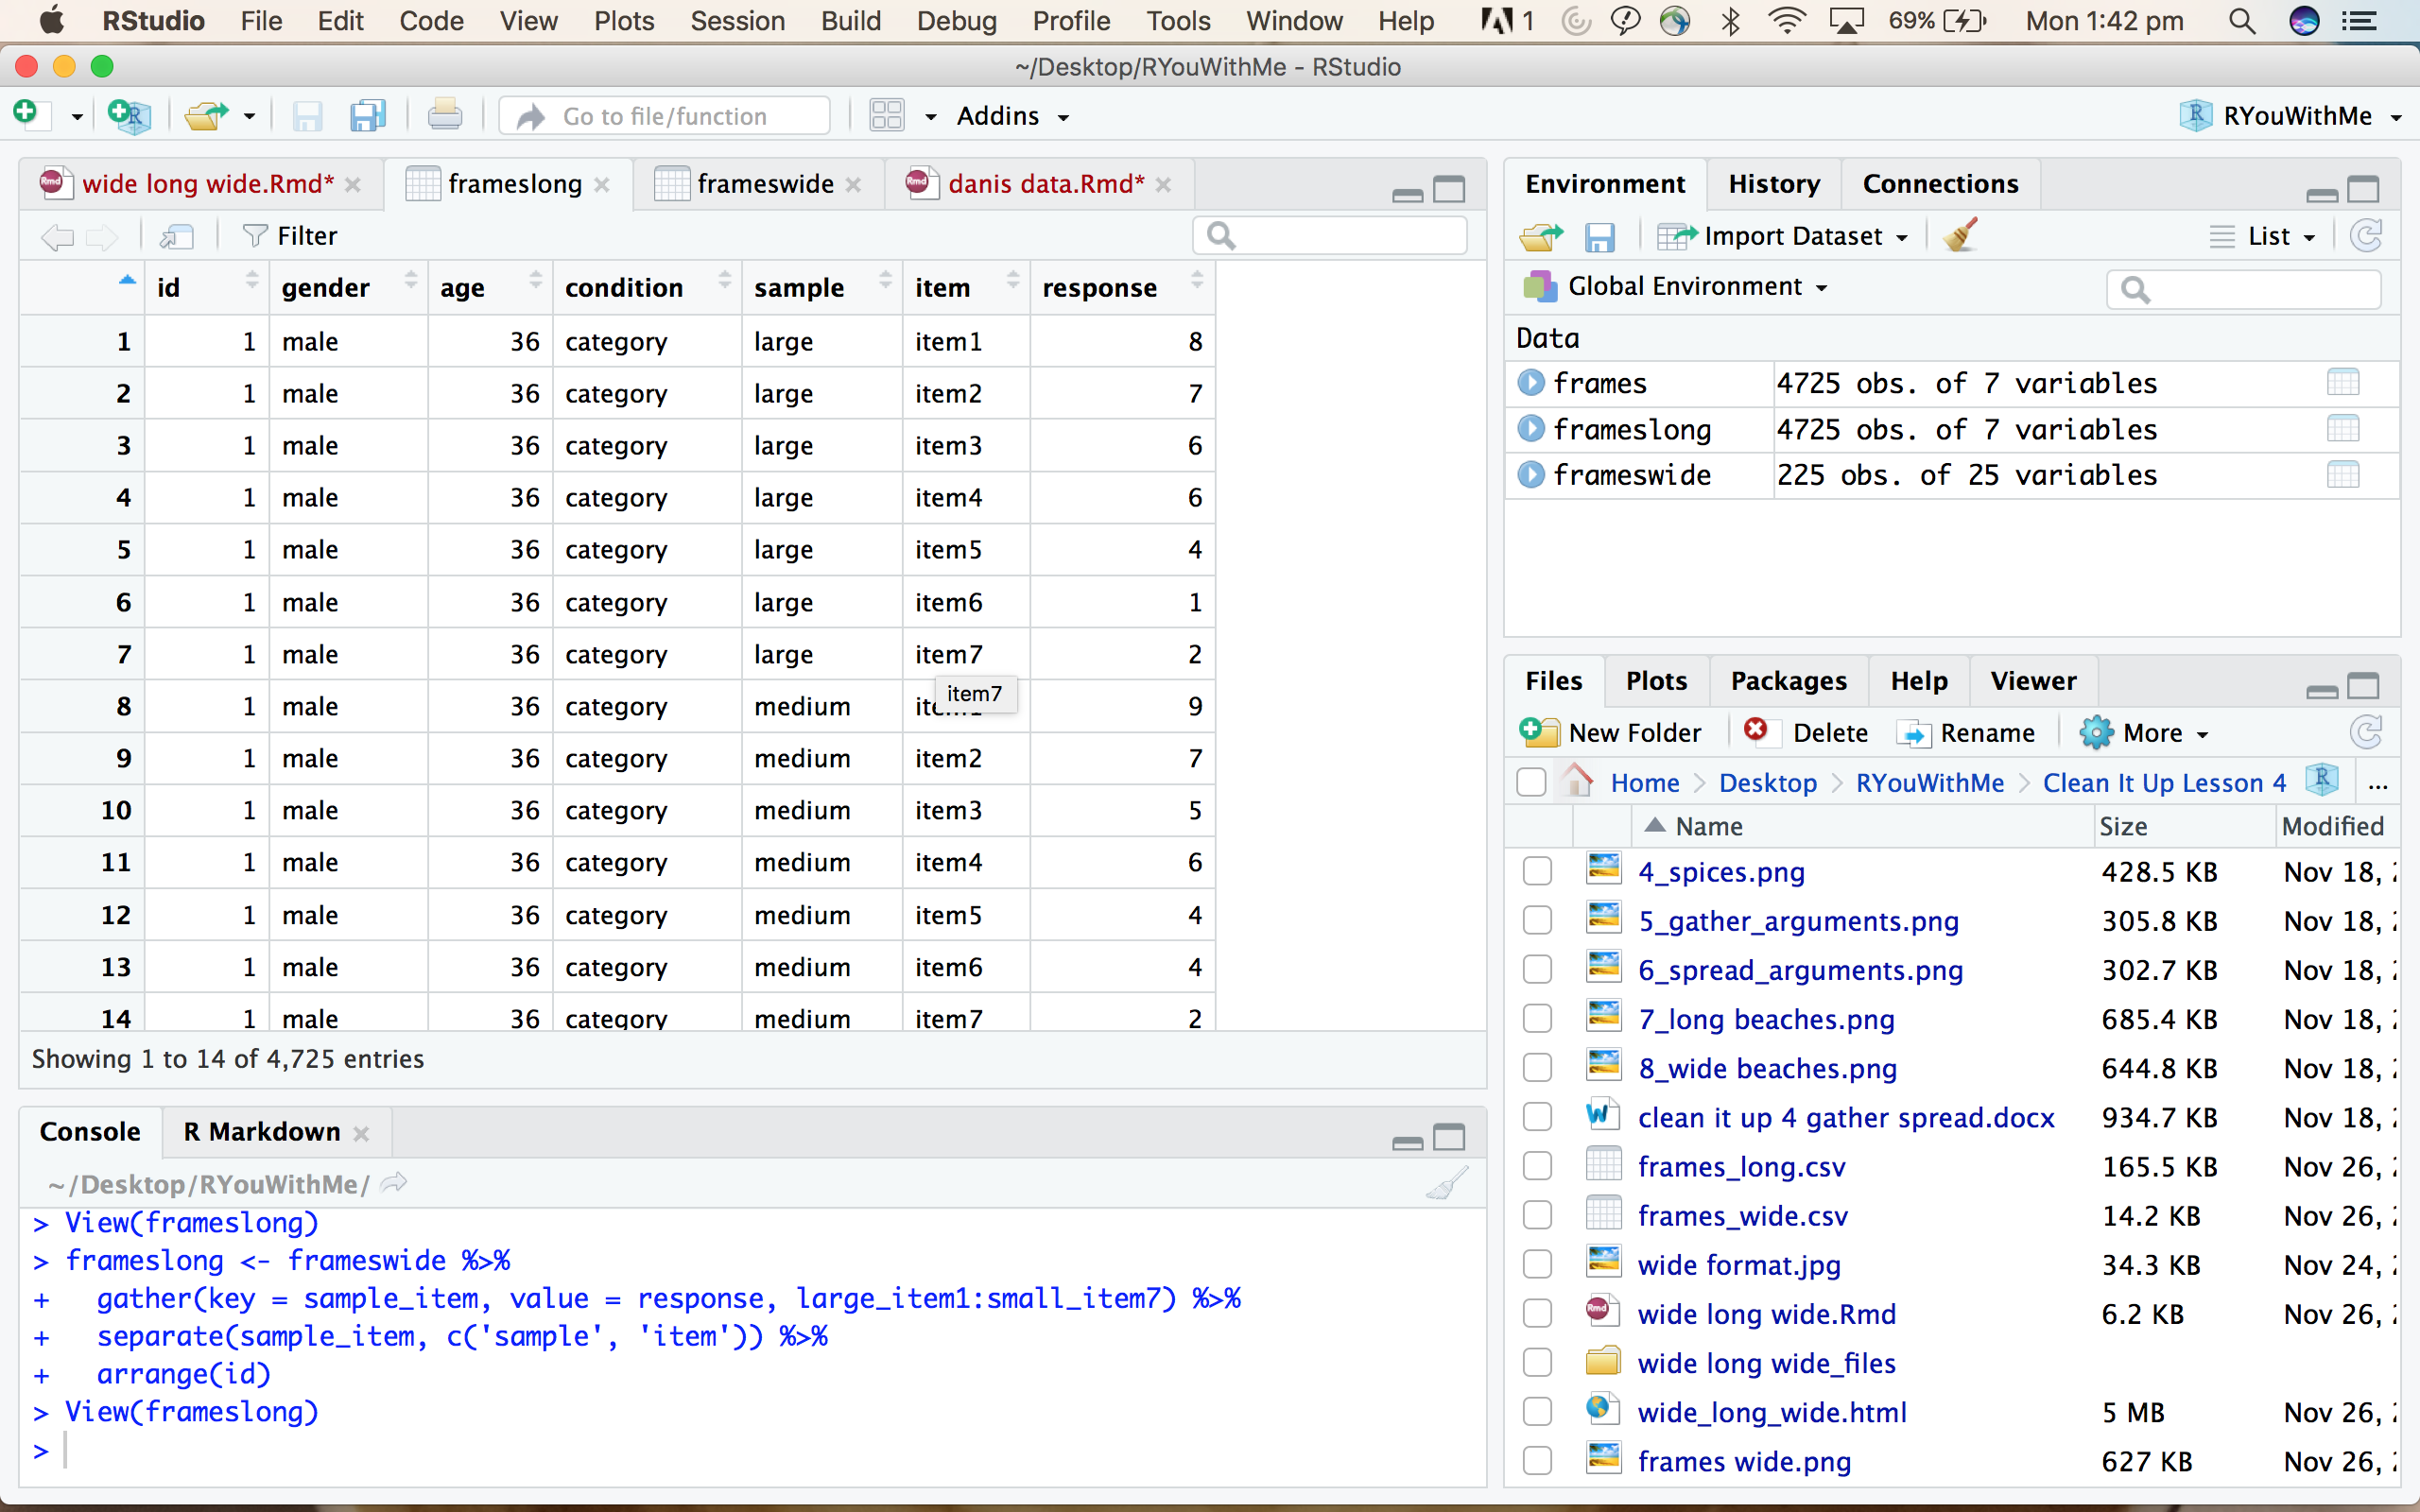
- use
separateto create two variables for the sample and item information - use
arrangeto make the dataframe look like this
Your turn: Try your own data
Is your data in wide format? No problem. Sort out answers to the following questions and you can convert it to long format with a single line of code.
- What should your “key” column be called?
- What are the “values”?
- Which columns do you want to gather?
Sydney-based R-Ladies - share your successes and any challenges you’ve faced in the #ryouwithme_2_cleaning Slack channel!
Looking for more?
Some additional links that might be helpful!